Note
Go to the end to download the full example code.
Reading EPR datasets (BES3T or ASCII format)
How to load EPR datasets in BES3T format (the file format used on Bruker ELEXSYS and EMX machines) or in ASCII format (whatever your EPR imaging system, you are likely able to export your EPR measurements in ASCII format, so you will be able to load the ASCII file in Python).
First of all, let us import the necessary modules and instantiate a PyEPRI backend (here numpy).
# -------------- #
# Import modules #
# -------------- #
import numpy as np
import matplotlib.pyplot as plt
import pyepri.backends as backends
import pyepri.datasets as datasets
import pyepri.io as io
plt.ion()

# -------------- #
# Create backend #
# -------------- #
#
# You can uncomment one line below to select another backend (if
# installed on your system).
#
backend = backends.create_numpy_backend()
#backend = backends.create_torch_backend('cpu') # uncomment here for torch-cpu backend
#backend = backends.create_cupy_backend() # uncomment here for cupy backend
#backend = backends.create_torch_backend('cuda') # uncomment here for torch-gpu backend
Load EPR datasets in BES3T format (.DTA and .DSC files)
Now let us open a BES3T dataset embedded with this package (you can
simply change the path_proj and path_h variables to open
your own dataset).
#--------------------#
# Load BES3T dataset #
#--------------------#
#
# In this example, we load a dataset made of the files
# ``phalanx-20220203-proj.{DSC,DTA}`` (projections) and
# ``phalanx-20220203-h.{DSC,DTA}`` (reference spectrum) stored in the
# ``datasets`` folder of the PyEPRI package.
#
# This dataset will be loaded in ``float32`` precision (you can also
# select ``float64`` precision by setting ``dtype='float64'``).
#
dtype = 'float32'
path_proj = datasets.get_path('phalanx-20220203-proj.DSC') # you can replace here by your own dataset (e.g., path_proj = '~/my_dataset1.DSC')
path_h = datasets.get_path('phalanx-20220203-h.DSC') # same comment
B, proj, param = io.read_bruker_bes3t_dataset(path_proj, dtype=dtype, backend=backend) # projections
_, h, _ = io.read_bruker_bes3t_dataset(path_h, dtype=dtype, backend=backend) # reference spectrum
fgrad = param['FGRAD'] # coordinates of the field gradient vectors for each projection
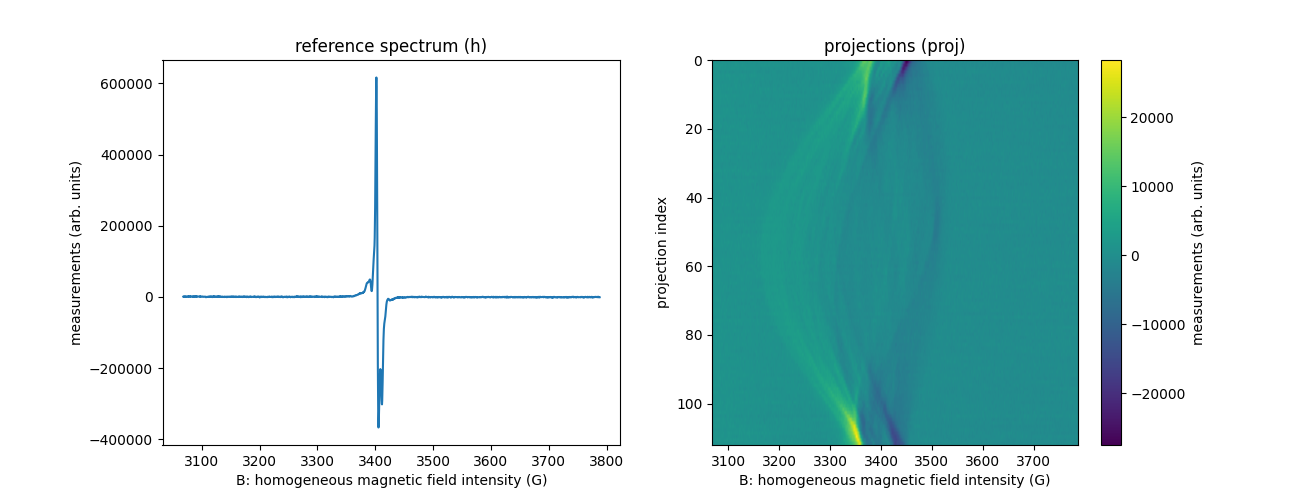
We describe below the content of the obtained arrays:
projis a two-dimensional array containing the projections (each row of the array represents a projection);Bis a mono-dimensional array corresponding to the homogeneous magnetic field sampling grid of the projections;fgradis a two-dimensional array containing the coordinates of the field gradient vectors used to acquire the projections (this dataset is a 2D imaging dataset containing 113 projections,fgradcontains 2 rows and 113 column;fgrad[0,j]andfgrad[1,j]correspond to the X-axis and Y-axis coordinate of the field gradient vector used to acquire the j-th projectionproj[j,:]); (each row of the array represents a projection);his a mono-dimensional array containing the zero-gradient spectrum of the imaged EPR sample (its sampling grid is identical to that stored inB).
Also, the param variable is a dictionary containing all
retrieved parameters in the .DSC file.
Remark: in this example, the loaded arrays B, proj and
h have type numpy.ndarray because a numpy backend was passed
to the pyepri.io.read_bruker_bes3t_dataset() function when
loading the data). With a different backend, different type of
arrays will be loaded (as explained in the CPU & GPU backends
tutorial).
Now let us display the retrieved signals using matplotlib. Note that
if you are using a cupy or pytorch backend, it is recommended to
send the data back to the CPU in numpy format and display those
numpy signals. This can be done using backend.to_numpy() (when
the backend is already a numpy backend, as it is the case in this
examples, the backend.to_numpy() simply returns its input
without doing any conversion).
#--------------------------------#
# display the reference spectrum #
#--------------------------------#
plt.figure(figsize=(13, 5))
plt.subplot(1, 2, 1)
plt.plot(backend.to_numpy(B), backend.to_numpy(h))
plt.xlabel('B: homogeneous magnetic field intensity (G)')
plt.ylabel('measurements (arb. units)')
plt.title('reference spectrum (h)')

#-------------------------#
# display the projections #
#-------------------------#
plt.subplot(1, 2, 2)
extent = (B[0].item(), B[-1].item(), proj.shape[0] - 1, 0)
plt.imshow(backend.to_numpy(proj), extent=extent, aspect='auto')
cbar = plt.colorbar()
cbar.set_label('measurements (arb. units)')
plt.xlabel('B: homogeneous magnetic field intensity (G)')
plt.ylabel('projection index')
_ = plt.title('projections (proj)')

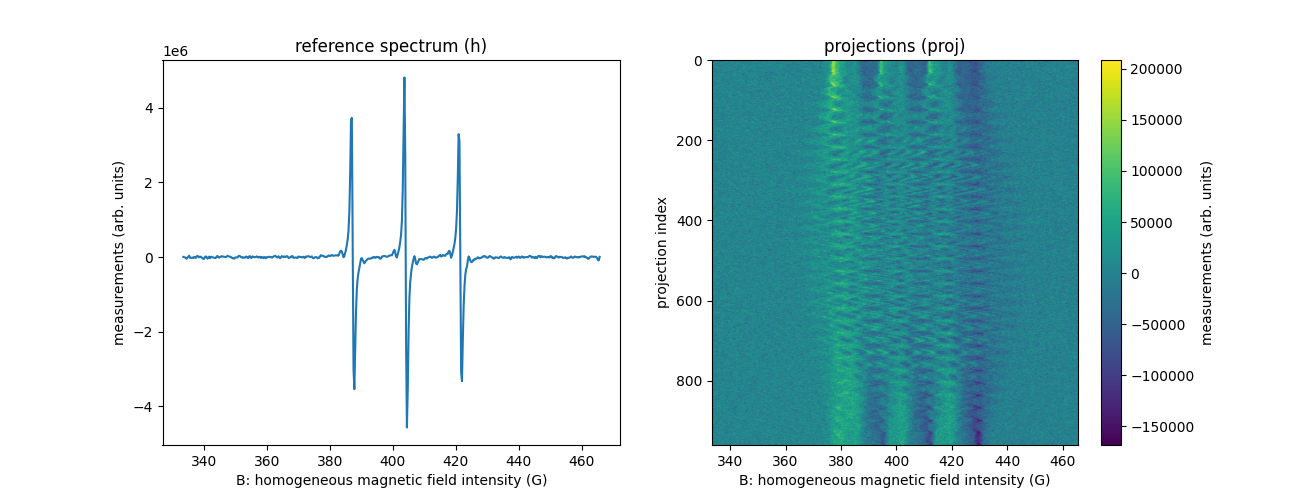
Let’s load another dataset corresponding to a 3D imaging
experiment. In this case, the fgrad array contains three rows
(and as many columns as number of acquired projections). The rows
with indexes 0, 1, and 2 respectively correspond to the X, Y and Z
axis coordinates of the field gradient vectors.
#----------------------------------------------------#
# Load another BES3T dataset (3D imaging experiment) #
#----------------------------------------------------#
#
# Let us load a dataset made of the files
# ``fusillo-20091002-h.{DSC,DTA}`` (reference spectrum) and
# ``fusillo-20091002-proj.{DSC,DTA}`` (projections) stored in the
# ``data`` folder of the PyEPRI package.
#
fname = 'fusillo-20091002'
path_proj = datasets.get_path('fusillo-20091002-proj.DSC') # you can replace here by your own dataset (e.g., path_proj = '~/my_dataset1.DSC')
path_h = datasets.get_path('fusillo-20091002-h.DSC') # same comment
B, proj, param = io.read_bruker_bes3t_dataset(path_proj, dtype=dtype, backend=backend) # projections
_, h, _ = io.read_bruker_bes3t_dataset(path_h, dtype=dtype, backend=backend) # reference spectrum
fgrad = param['FGRAD'] # coordinates of the field gradient vectors for each projection

#--------------------------------#
# display the reference spectrum #
#--------------------------------#
plt.figure(figsize=(13, 5))
plt.subplot(1, 2, 1)
plt.plot(backend.to_numpy(B), backend.to_numpy(h))
plt.xlabel('B: homogeneous magnetic field intensity (G)')
plt.ylabel('measurements (arb. units)')
plt.title('reference spectrum (h)')

#-------------------------#
# display the projections #
#-------------------------#
plt.subplot(1, 2, 2)
extent = (B[0].item(), B[-1].item(), proj.shape[0] - 1, 0)
plt.imshow(backend.to_numpy(proj), extent=extent, aspect='auto')
cbar = plt.colorbar()
cbar.set_label('measurements (arb. units)')
plt.xlabel('B: homogeneous magnetic field intensity (G)')
plt.ylabel('projection index')
_ = plt.title('projections (proj)')

Load EPR datasets in ASCII format
Whatever your EPR imaging system, you can probably manage to save
your data in ASCII format (that is, a simple text file containing
the numeric values of your measurements). These kind of data can be
easily loaded using the numpy.loadtxt() function of the
Numpy library.
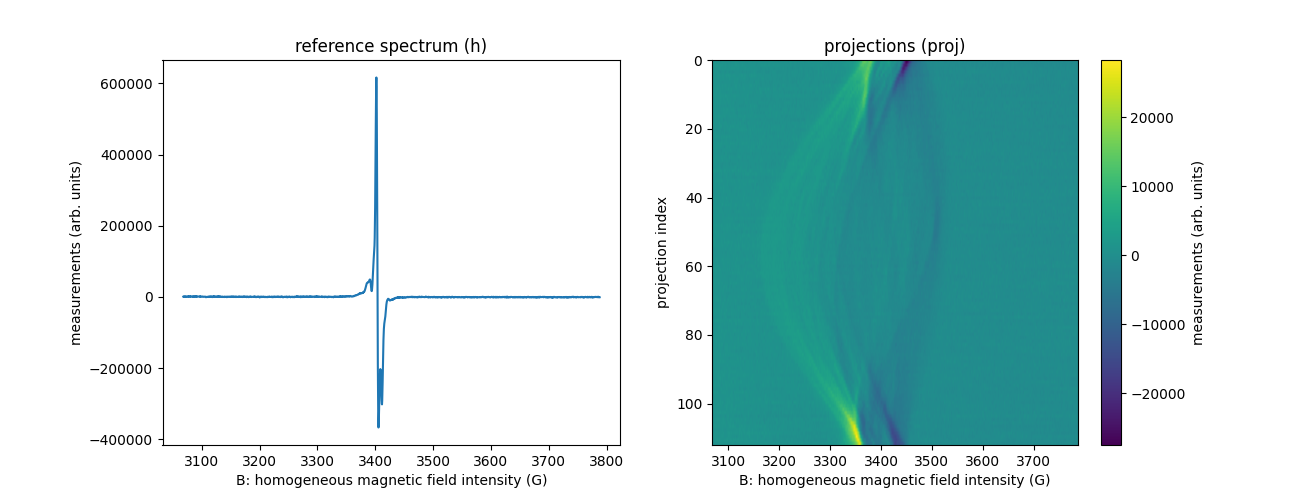
In the example below, we load again the phalanx phalanx-20220203
dataset from ASCII files containing the measurements.
Type help(np.loadtxt) to check the documentation of the
numpy.loadtxt() function and adapt the code presented below
to your own ASCII files.
#-----------------------------------------------#
# Load an ASCII dataset (2D imaging experiment) #
#-----------------------------------------------#
#
# Let us load a dataset made of the files ``phalanx-20220203-h.txt``
# (reference spectrum), ``phalanx-20220203-proj.txt`` (projections),
# ``phalanx-20220203-B.txt`` (sampling nodes) and
# ``phalanx-20220203-h.txt`` (coordinates of the field gradient
# vectors) stored in the ``datasets`` folder of the PyEPRI package.
#
fname = 'phalanx-20220203'
path_proj = datasets.get_path('phalanx-20220203-proj.txt') # you can replace here by your own dataset (e.g., path_proj = '~/my_dataset1.txt')
path_B = datasets.get_path('phalanx-20220203-B.txt') # same comment
path_fgrad = datasets.get_path('phalanx-20220203-fgrad.txt') # same comment
path_h = datasets.get_path('phalanx-20220203-h.txt') # same comment
B = backend.from_numpy(np.loadtxt(path_B, delimiter=' ', dtype=dtype)) # load from file 'phalanx-20220203-B.txt'
h = backend.from_numpy(np.loadtxt(path_h, delimiter=' ', dtype=dtype)) # load from file 'phalanx-20220203-h.txt'
proj = backend.from_numpy(np.loadtxt(path_proj, delimiter=' ', dtype=dtype)) # load from file 'phalanx-20220203-proj.txt'
fgrad = backend.from_numpy(np.loadtxt(path_fgrad, delimiter=' ', dtype=dtype)) # load from file 'phalanx-20220203-fgrad.txt'

#--------------------------------#
# display the reference spectrum #
#--------------------------------#
plt.figure(figsize=(13, 5))
plt.subplot(1, 2, 1)
plt.plot(backend.to_numpy(B), backend.to_numpy(h))
plt.xlabel('B: homogeneous magnetic field intensity (G)')
plt.ylabel('measurements (arb. units)')
plt.title('reference spectrum (h)')

#-------------------------#
# display the projections #
#-------------------------#
plt.subplot(1, 2, 2)
extent = (B[0].item(), B[-1].item(), proj.shape[0] - 1, 0)
plt.imshow(backend.to_numpy(proj), extent=extent, aspect='auto')
cbar = plt.colorbar()
cbar.set_label('measurements (arb. units)')
plt.xlabel('B: homogeneous magnetic field intensity (G)')
plt.ylabel('projection index')
_ = plt.title('projections (proj)')

Note that in the above commands, the ASCII files are loaded as numpy
arrays using np.loadtxt. The command backend.from_numpy is
used to convert those numpy arrays into the appropriate array type
depending on the backend that you are using.
Total running time of the script: (0 minutes 0.662 seconds)
Estimated memory usage: 236 MB