Note
Go to the end to download the full example code.
Backprojection operators
Presentation of the backprojection operators (= adjoint of the projections operators).
In the previous example, the projection operators implemented in the PyEPRI package were presented. Those projection operators take as input one (or several) image(s) and return one (or several) sequence(s) of EPR projections (= sinogram(s)). Mathematically, a projection operation can be modeled by a linear mapping. A backprojection operator is also a linear mapping and corresponds to the adjoint of a projection operator.
We list below the projection (\(A\)) and corresponding backprojection (\(A^*\)) operators implemented in the PyEPRI package. We refer to the Mathematical definitions section of the documentation for the formal description of those operators.
Projection operator \(A\) |
Adjoint (= backprojection) operator \(A^*\) |
|---|---|
The correctness (up to machine precision) of the adjointess relation between each operator pair \((A, A^*)\) can be verified by running the unitary tests of the PyEPRI package.
Important: a backprojection operator takes as input one (or several) sequence(s) of EPR projections (= sinogram(s)) and returns one (or several) image(s). However, a projection operator \(A\) and its corresponding backprojection operator \(A^*\) are not inverses of each other.
For instance, the pyepri.monosrc.proj3d() operator maps a
single 3D image to a single sequence of EPR projections. Applying
this projection operator to a given image, and applying afterwards
the pyepri.monosrc.backproj3d() backprojection operator to the
this sequence of EPR projections does not lead back to the initial
image (it actually leads to a filtered version of the initial
image).
Although projection and backprojection are not inverse operations, both operators are key elements of the modern inversion techniques based on variational models for the corresponding projection operators. The modern EPR image reconstruction algorithms indeed rely on backprojection as a single step of a more complex reconstruction process.
We shall present now the backprojection operators implemented in the PyEPRI package.
Single EPR source (2D setting)
Let us generate a synthetic two-dimensional image, a synthetic
reference spectrum and use the pyepri.monosrc.proj2d()
function to generate a synthetic sequence of EPR projections.
# -------------- #
# Import modules #
# -------------- #
import math
import matplotlib.pyplot as plt
import numpy as np
import pyepri.backends as backends
import pyepri.monosrc as monosrc
import pyepri.multisrc as multisrc
import pyvista as pv
plt.ion()

# -------------- #
# Create backend #
# -------------- #
#
# You can uncomment one line below to select another backend (if
# installed on your system).
#
backend = backends.create_numpy_backend()
#backend = backends.create_torch_backend('cpu') # uncomment here for torch-cpu backend
#backend = backends.create_cupy_backend() # uncomment here for cupy backend
#backend = backends.create_torch_backend('cuda') # uncomment here for torch-gpu backend

# -------------------------------------------------------------- #
# Compute synthetic inputs (2D image, reference spectrum & field #
# gradient vector coordinates)                                   #
# -------------------------------------------------------------- #

# synthetic 2D image
dtype = 'float32'
delta = 5e-3 # sampling step (cm)
Nx, Ny = 550, 400 # image size
xgrid = (-(Nx//2) + backend.arange(Nx, dtype=dtype)) * delta # sampling grid along the X-axis
ygrid = (-(Ny//2) + backend.arange(Ny, dtype=dtype)) * delta # sampling grid along the Y-axis
X, Y = backend.meshgrid(xgrid, ygrid) # spatial sampling grid
u1 = backend.cast(((X - .2)**2 + (Y + .2)**2 <= .08**2), dtype)
u2 = backend.cast((X + .2)**2 + (Y - .2)**2 <= .08**2, dtype)
u3 = backend.cast((X + .2)**2 + (Y + .2)**2 <= .05**2, dtype)
u4 = backend.cast((X - .2)**2 + (Y - .2)**2 <= .05**2, dtype)
u = u1 + u2 + u3 + u4
u /= (delta ** 2) * u.sum()

# synthetic reference spectrum (simple Gaussian derivative)
B = backend.linspace(380, 420, 512, dtype=dtype)
Br = 400
sig = .3
cof = 1. / (sig * math.sqrt(2. * math.pi))
h = - cof * (B - Br) / sig**2 * backend.exp(- (B - Br)**2 / (2. * sig**2))

# field gradient vector coordinates (one vector per projection to
# compute)
theta = backend.linspace(0, 2. * math.pi, 100, dtype=dtype) # field gradient orientations
mu = 20 # field gradient amplitude (G/cm)
gx = mu * backend.cos(theta) # X-axis coordinates of the field gradient vectors
gy = mu * backend.sin(theta) # Y-axis coordinates of the field gradient vectors
fgrad = backend.stack((gx, gy))

# ----------------------------- #
# Compute synthetic projections #
# ----------------------------- #
proj = monosrc.proj2d(u, delta, B, h, fgrad, backend=backend)

# ---------------------------- #
# Display signals (u, h, proj) #
# ---------------------------- #

# input image
plt.figure(figsize=(19.5, 4.2))
plt.subplot(1, 3, 1)
extent = [t.item() for t in (xgrid[0], xgrid[-1], ygrid[0], ygrid[-1])]
plt.imshow(backend.to_numpy(u), extent=extent, origin='lower')
plt.xlabel('X (cm)')
plt.ylabel('Y (cm)')
plt.title('input image')

# input reference spectrum
plt.subplot(1, 3, 2)
plt.plot(backend.to_numpy(B), backend.to_numpy(h))
plt.grid(linestyle=':')
plt.xlabel('B: homogeneous magnetic field (G)')
plt.ylabel('spectrum (arb. unit)')
plt.title('input reference spectrum')

# computed projections
plt.subplot(1, 3, 3)
extent = (B[0].item(), B[-1].item(), proj.shape[0] - 1, 0)
plt.imshow(backend.to_numpy(proj), extent=extent, aspect='auto')
plt.xlabel('B: homogeneous magnetic field (G)')
plt.ylabel('projection index')
_ = plt.title('output sequence of projections (sinogram)')

Now, let us use the pyepri.monosrc.backproj2d() function to
backproject the sequence of EPR projections (or sinogram) displayed
above.
# ------------------------------------------- #
# Backproject the sequence of EPR projections #
# ------------------------------------------- #
out_shape = (Ny, Nx)
out = monosrc.backproj2d(proj, delta, B, h, fgrad, out_shape, backend=backend)

# --------------------------------------------------------------- #
# Display the backprojected image in front of the reference image #
# --------------------------------------------------------------- #

# reference image
plt.figure(figsize=(13.2, 4.2))
plt.subplot(1, 2, 1)
extent = [t.item() for t in (xgrid[0], xgrid[-1], ygrid[0], ygrid[-1])]
plt.imshow(backend.to_numpy(u), extent=extent, origin='lower')
plt.xlabel('X (cm)')
plt.ylabel('Y (cm)')
plt.title('reference image')

# backprojected image
plt.subplot(1, 2, 2)
extent = [t.item() for t in (xgrid[0], xgrid[-1], ygrid[0], ygrid[-1])]
plt.imshow(backend.to_numpy(out), extent=extent, origin='lower')
plt.xlabel('X (cm)')
plt.ylabel('Y (cm)')
_ = plt.title('backprojected image')

Remark: the out_shape input parameter of the
pyepri.monosrc.backproj2d() can be changed and set to a
value different from the shape of the reference image, as done
below.
# -------------------------------------------- #
# Backprojection using difference output shape #
# -------------------------------------------- #
Nx2, Ny2 = 200, 250
xgrid2 = (-(Nx2//2) + backend.arange(Nx2, dtype=dtype)) * delta
ygrid2 = (-(Ny2//2) + backend.arange(Ny2, dtype=dtype)) * delta
out_shape = (Ny2, Nx2)
out2 = monosrc.backproj2d(proj, delta, B, h, fgrad, out_shape, backend=backend)

# --------------------------- #
# Display backprojected image #
# --------------------------- #

# reference image
plt.figure(figsize=(13.2, 4.2))
plt.subplot(1, 2, 1)
extent = [t.item() for t in (xgrid[0], xgrid[-1], ygrid[0], ygrid[-1])]
plt.imshow(backend.to_numpy(u), extent=extent, origin='lower')
plt.xlabel('X (cm)')
plt.ylabel('Y (cm)')
plt.title('reference image')

# backprojected image
plt.subplot(1, 2, 2)
extent = [t.item() for t in (xgrid2[0], xgrid2[-1], ygrid2[0], ygrid2[-1])]
plt.imshow(backend.to_numpy(out2), extent=extent, origin='lower')
ax = plt.gca()
ax.set_xlim((xgrid[0].item(), xgrid[-1].item()))
ax.set_ylim((ygrid[0].item(), ygrid[-1].item()))
plt.xlabel('X (cm)')
plt.ylabel('Y (cm)')
_ = plt.title('backprojected image')

It must be noted that, under this setting, the two performed operations (projection and backprojection) are not adjoint anymore.
Single EPR source (3D setting)
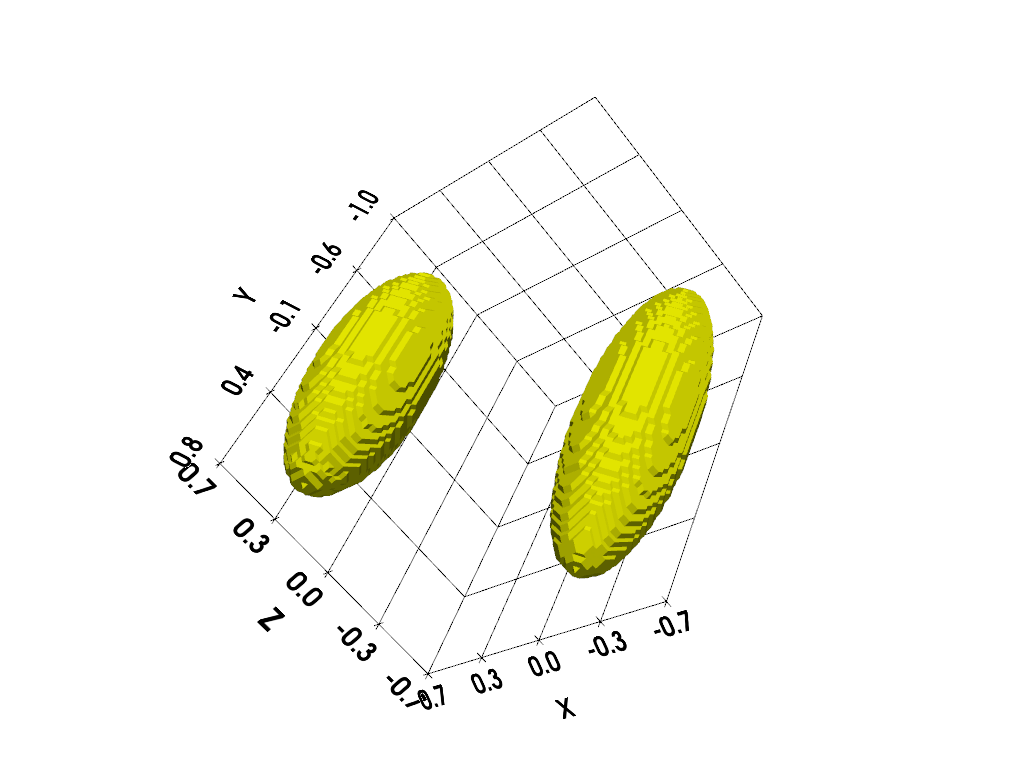
We perform below the same kind of experiment using a three-dimensional setting. First, let us compute a three-dimensional synthetic reference image.
# --------------------------------------------------------- #
# Compute a synthetic 3D input image made of two ellipsoids #
# --------------------------------------------------------- #
Nx, Ny, Nz = 128, 256, 128 # image dimensions
delta = .02 # spatial sampling step (cm)
xgrid = (-(Nx//2) + backend.arange(Nx, dtype=dtype)) * delta
ygrid = (-(Ny//2) + backend.arange(Ny, dtype=dtype)) * delta
zgrid = (-(Nz//2) + backend.arange(Nz, dtype=dtype)) * delta
X, Y, Z = backend.meshgrid(xgrid, ygrid, zgrid)
v1 = (((X - .4) / .25)**2 + ((Y - .1) / .7)**2 + (((Z - .4) / .25)**2) <= 1.)
v2 = (((X + .4) / .25)**2 + ((Y + .1) / .9)**2 + (((Z + .4) / .25)**2) <= 1.)
v = backend.cast(v1, dtype) + backend.cast(v2, dtype)
v /= (delta**3 * v.sum())

# ----------------------------------- #
# Display input 3D image (isosurface) #
# ----------------------------------- #

# compute isosurface sampling grid
grid = pv.StructuredGrid(backend.to_numpy(X), backend.to_numpy(Y), backend.to_numpy(Z))

# compute isosurface
vol = np.moveaxis(backend.to_numpy(v), (0,1,2), (2,1,0))
grid["vol"] = vol.flatten()
l1 = vol.max()
l0 = .2 * l1
isolevels = np.linspace(l0, l1, 10)
contours = grid.contour(isolevels)

# display isosurface
cpos = [(-3.8, 4.35, 2.11), (0.0, -0.1, 0.0), (-0.33, -0.62, 0.71)]
p = pv.Plotter()
p.camera_position = cpos
labels = dict(ztitle='Z', xtitle='X', ytitle='Y')
p.add_mesh(contours, show_scalar_bar=False, color='#f7fe00')
p.show_grid(**labels)
p.show()
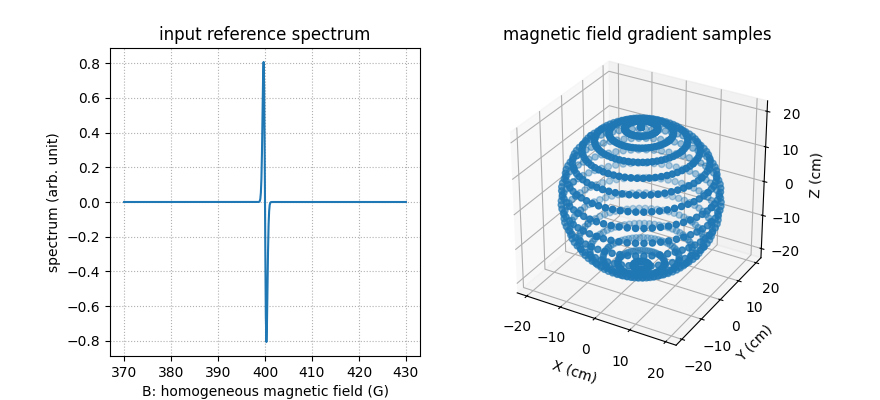
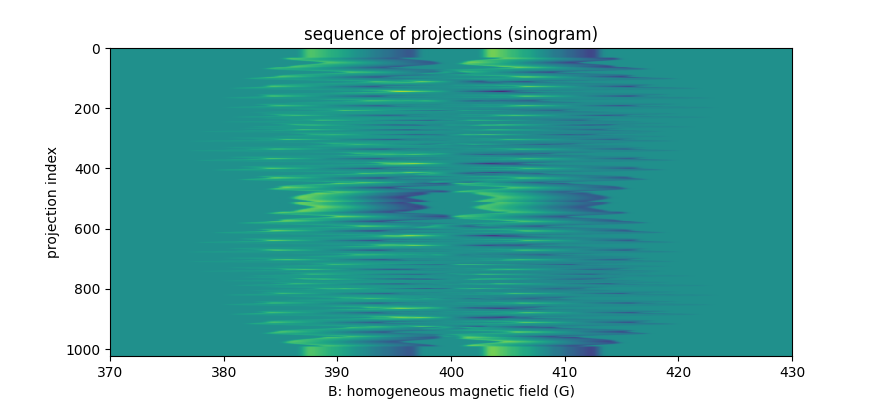
Next, let us generate a synthetic reference spectrum, some field
gradient vector coordinates, and let us compute the EPR projections
of the reference 3D image using the pyepri.monosrc.proj3d()
function.
# ------------------------------------------------------------ #
# Compute synthetic reference spectrum & field gradient vector #
# coordinates                                                  #
# ------------------------------------------------------------ #

# synthetic reference spectrum (simple Gaussian derivative)
B = backend.linspace(370, 430, 512, dtype=dtype)
Br = 400
sig = .3
cof = 1. / (sig * math.sqrt(2. * math.pi))
h = - cof * (B - Br) / sig**2 * backend.exp(- (B - Br)**2 / (2. * sig**2))

# field gradient vector coordinates
t1 = backend.linspace(0, 2. * math.pi, 32, dtype=dtype)
t2 = backend.linspace(0, 2. * math.pi, 32, dtype=dtype)
theta1, theta2 = backend.meshgrid(t1, t2)
theta1 = theta1.reshape((-1,)) # polar angles of the field gradients
theta2 = theta2.reshape((-1,)) # azimuthal angles of the field gradients
mu = 20. # field gradient amplitude (G/cm)
gx = mu * backend.cos(theta1) * backend.sin(theta2) # X-axis coordinates of the field gradient vectors
gy = mu * backend.sin(theta1) * backend.sin(theta2) # Y-axis coordinates of the field gradient vectors
gz = mu * backend.cos(theta2) # Z-axis coordinates of the field gradient vectors
fgrad = backend.stack((gx, gy, gz))

# ------------------- #
# Compute projections #
# ------------------- #
proj = monosrc.proj3d(v, delta, B, h, fgrad, backend=backend)


# ------- #
# Display #
# ------- #

# reference spectrum
fig = plt.figure(figsize=(8.8, 4.))
fig.add_subplot(1, 2, 1)
plt.plot(backend.to_numpy(B), backend.to_numpy(h))
plt.grid(linestyle=':')
plt.xlabel('B: homogeneous magnetic field (G)')
plt.ylabel('spectrum (arb. unit)')
plt.title('input reference spectrum')

# magnetic field gradient vectors
ax = fig.add_subplot(1, 2, 2, projection='3d')
ax.scatter(backend.to_numpy(fgrad[0]), backend.to_numpy(fgrad[1]), backend.to_numpy(fgrad[2]))
ax.set_xlabel('X (cm)')
ax.set_ylabel('Y (cm)')
ax.set_zlabel('Z (cm)')
ax.set_aspect('equal', 'box')
_ = plt.title('magnetic field gradient samples')

# projections
plt.figure(figsize=(8.8, 4.))
extent = (B[0].item(), B[-1].item(), proj.shape[0] - 1, 0)
plt.imshow(backend.to_numpy(proj), extent=extent, aspect='auto')
plt.xlabel('B: homogeneous magnetic field (G)')
plt.ylabel('projection index')
_ = plt.title('sequence of projections (sinogram)')
Now, we can perform the backprojection of the sequence of projection
using the pyepri.monosrc.backproj3d() function.
# ---------------------- #
# Perform backprojection #
# ---------------------- #
out_shape = (Ny, Nx, Nz)
out = monosrc.backproj3d(proj, delta, B, h, fgrad, out_shape, backend=backend)

# -------------------------- #
# Display (ZX central slice) #
# -------------------------- #

# reference volume
plt.figure(figsize=(10., 4.5))
plt.subplot(1, 2, 1)
extent = [t.item() for t in (xgrid[0], xgrid[-1], zgrid[0], zgrid[-1])]
plt.imshow(backend.to_numpy(v[Ny//2, :, :]), extent=extent, origin='lower')
plt.xlabel('X (cm)')
plt.ylabel('Z (cm)')
plt.title('reference volume (ZX slice, Y = %g)' % ygrid[Ny//2].item())

# backprojected volume
plt.subplot(1, 2, 2)
extent = [t.item() for t in (xgrid[0], xgrid[-1], zgrid[0], zgrid[-1])]
plt.imshow(backend.to_numpy(out[Ny//2, :, :]), extent=extent, origin='lower')
plt.xlabel('X (cm)')
plt.ylabel('Z (cm)')
_ = plt.title('backprojected volume (ZX slice, Y = %g)' % ygrid[Ny//2].item())
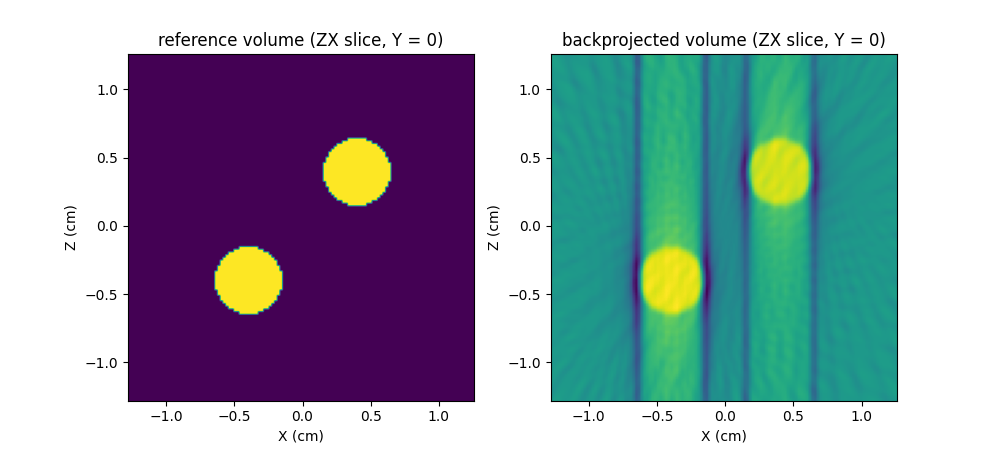
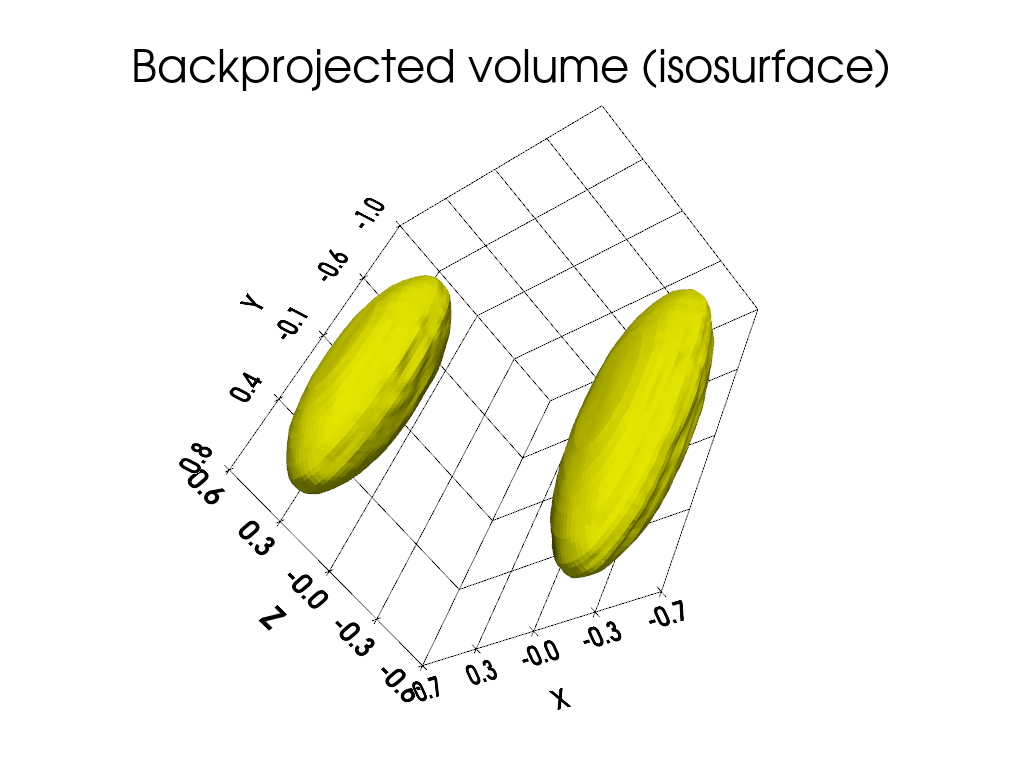
We also display below an isosurface of the backprojected volume. As in the two dimensional case, the backprojected volume is different to the reference volume that was used to synthesize the projections. The backprojected volume actually corresponds to a filtered version of the reference volume.
# ---------------------------------------------- #
# Display isosurface of the backprojected volume #
# ---------------------------------------------- #

# compute isosurface sampling grid
grid = pv.StructuredGrid(backend.to_numpy(X), backend.to_numpy(Y), backend.to_numpy(Z))

# compute isosurface
vol = np.moveaxis(backend.to_numpy(out), (0,1,2), (2,1,0))
grid["vol"] = vol.flatten()
l1 = vol.max()
l0 = .6 * l1
isolevels = np.linspace(l0, l1, 10)
contours = grid.contour(isolevels)

# display isosurface
cpos = [(-3.8, 4.35, 2.11), (0.0, -0.1, 0.0), (-0.33, -0.62, 0.71)]
p = pv.Plotter()
p.camera_position = cpos
labels = dict(ztitle='Z', xtitle='X', ytitle='Y')
p.add_mesh(contours, show_scalar_bar=False, color='#f7fe00')
p.show_grid(**labels)
p.add_title("Backprojected volume (isosurface)")
p.show()
Multiple EPR sources (2D setting)
In the following example, let us use the function
pyepri.multisrc.proj2d() to compute projections from a
synthetic sample containing two different (synthetic) paramagnetic
species in the two-dimensional setting. We will then use the
pyepri.multisrc.backproj2d() function to backproject those
projections, leading to two 2D output images.
# ------------------------------------------------------------------ #
# Compute synthetic image of the first EPR source (one disk) and its #
# associated reference spectrum (one single line)                    #
# ------------------------------------------------------------------ #

# synthetic 2D image of the first EPR source (disk)
dtype = 'float32'
delta = 5e-3 # sampling step (cm)
Nx, Ny = 550, 400 # image size
xgrid = (-(Nx//2) + backend.arange(Nx, dtype=dtype)) * delta # sampling grid along the X-axis
ygrid = (-(Ny//2) + backend.arange(Ny, dtype=dtype)) * delta # sampling grid along the Y-axis
X, Y = backend.meshgrid(xgrid, ygrid) # spatial sampling grid
u1 = backend.cast(((X + .3)**2 + (Y - .2)**2 <= .1**2), dtype)
u1 /= (delta ** 2) * u1.sum()

# synthetic reference spectrum of the first EPR source (one line
# spectrum synthesized as the derivative of a Gaussian function)
B = backend.linspace(360, 440, 1200, dtype=dtype)
Br1 = 399
sig1 = .36
cof1 = 1. / (sig1 * math.sqrt(2. * math.pi))
h1 = - cof1 * (B - Br1) / sig1**2 * backend.exp(- (B - Br1)**2 / (2. * sig1**2))

# --------------------------------------------------------------- #
# Compute synthetic image of the second EPR source (another disk) #
# and its associated reference spectrum (three lines spectrum)    #
# --------------------------------------------------------------- #

# synthetic 2D image of the second EPR source (disk)
u2 = backend.cast(((X - .3)**2 + (Y + .2)**2 <= .1**2), dtype)
u2 /= (delta ** 2) * u2.sum()

# synthetic reference spectrum of the second EPR source (three line
# spectrum computed by summing shifted Gaussian derivatives)
Br2_left = 382
Br2_middle = 398
Br2_right = 414
sig2 = .8
cof2 = 1. / (3. * sig2 * math.sqrt(2. * math.pi))
h2_left = - cof2 * (B - Br2_left) / sig2**2 * backend.exp(- (B - Br2_left)**2 / (2. * sig2**2))
h2_middle = - cof2 * (B - Br2_middle) / sig2**2 * backend.exp(- (B - Br2_middle)**2 / (2. * sig2**2))
h2_right = - cof2 * (B - Br2_right) / sig2**2 * backend.exp(- (B - Br2_right)**2 / (2. * sig2**2))
h2 = h2_left + h2_middle + h2_right

# -------------------------------------------------------------------- #
# Compute field gradient vector coordinates (one vector per projection #
# to compute)                                                          #
# -------------------------------------------------------------------- #
theta = backend.linspace(0, 2. * math.pi, 100, dtype=dtype) # field gradient orientations
mu = 20 # field gradient amplitude (G/cm)
gx = mu * backend.cos(theta) # X-axis coordinates of the field gradient vectors
gy = mu * backend.sin(theta) # Y-axis coordinates of the field gradient vectors
fgrad = backend.stack((gx, gy))

# --------------------------------------------------- #
# Compute projections of the multisources EPR mixture #
# --------------------------------------------------- #
proj = multisrc.proj2d((u1, u2), delta, B, ((h1, h2),), (fgrad,), backend=backend)

# -------------------------------------------------------------- #
# Display input images, reference spectra & computed projections #
# -------------------------------------------------------------- #

# prepare display
fig = plt.figure(layout='constrained', figsize=(14., 4.))
subfigs = fig.subfigures(1, 2, wspace=0.07)
ax_left = subfigs[0].subplots(2, 2)
ax_right = subfigs[1].subplots(1, 1)
#clim = [min(u1.min().item(), u2.min().item()), max(u1.max().item(), u2.max().item())]

# first EPR source image
extent = [t.item() for t in (xgrid[0], xgrid[-1], ygrid[0], ygrid[-1])]
im1 = ax_left[0][0].imshow(backend.to_numpy(u1), extent=extent, origin='lower')
ax_left[0][0].set_xlabel('X (cm)')
ax_left[0][0].set_ylabel('Y (cm)')
ax_left[0][0].set_title('image source #1')
#im1.set_clim(clim)
#subfigs[0].colorbar(im1)

# first EPR source reference spectrum
ax_left[0][1].plot(backend.to_numpy(B), backend.to_numpy(h1))
ax_left[0][1].set_xlabel('B: homogeneous magnetic field (G)')
ax_left[0][1].set_ylabel('spectrum (arb. unit)')
ax_left[0][1].set_title('reference spectrum source #1')

# second EPR source image
extent = [t.item() for t in (xgrid[0], xgrid[-1], ygrid[0], ygrid[-1])]
im2 = ax_left[1][0].imshow(backend.to_numpy(u2), extent=extent, origin='lower')
ax_left[1][0].set_xlabel('X (cm)')
ax_left[1][0].set_ylabel('Y (cm)')
ax_left[1][0].set_title('image source #2')
#im2.set_clim(clim)
#subfigs[0].colorbar(im2)

# second EPR source reference spectrum
ax_left[1][1].plot(backend.to_numpy(B), backend.to_numpy(h2))
ax_left[1][1].set_ylim(ax_left[0][1].get_ylim())
ax_left[1][1].set_xlabel('B: homogeneous magnetic field (G)')
ax_left[1][1].set_ylabel('spectrum (arb. unit)')
ax_left[1][1].set_title('reference spectrum source #2')

# computed projections
extent = (B[0].item(), B[-1].item(), proj[0].shape[0] - 1, 0)
ax_right.imshow(backend.to_numpy(proj[0]), extent=extent, aspect='auto')
ax_right.set_xlabel('B: homogeneous magnetic field (G)')
ax_right.set_ylabel('projection index')
_ = ax_right.set_title('output sequence of projections (sinogram)')

Now, let us perform the backprojection operation using the
pyepri.multisrc.backproj2d() function.
# ---------------------- #
# Perform backprojection #
# ---------------------- #
out_shape_src1 = (Ny, Nx) # shape of the ouput source image #1
out_shape_src2 = (Ny, Nx) # shape of the ouput source image #2
out_shape = (out_shape_src1, out_shape_src2)
out = multisrc.backproj2d(proj, delta, B, ((h1, h2),), (fgrad,), out_shape, backend=backend)

# ---------------------------------------- #
# Display reference & backprojected images #
# ---------------------------------------- #

# reference source image #1
plt.figure(figsize=(13.4, 10.1))
plt.subplot(2, 2, 1)
extent = [t.item() for t in (xgrid[0], xgrid[-1], ygrid[0], ygrid[-1])]
plt.imshow(backend.to_numpy(u1), extent=extent, origin='lower')
plt.xlabel('X (cm)')
plt.ylabel('Y (cm)')
plt.title('reference source image #1')

# reference source image #2
plt.subplot(2, 2, 2)
plt.imshow(backend.to_numpy(u2), extent=extent, origin='lower')
plt.xlabel('X (cm)')
plt.ylabel('Y (cm)')
plt.title('reference source image #2')

# backprojected source image #1
plt.subplot(2, 2, 3)
plt.imshow(backend.to_numpy(out[0]), extent=extent, origin='lower')
plt.xlabel('X (cm)')
plt.ylabel('Y (cm)')
plt.title('backprojected image #1')

# backprojected source image #2
plt.subplot(2, 2, 4)
plt.imshow(backend.to_numpy(out[1]), extent=extent, origin='lower')
plt.xlabel('X (cm)')
plt.ylabel('Y (cm)')
_ = plt.title('backprojected image #2')
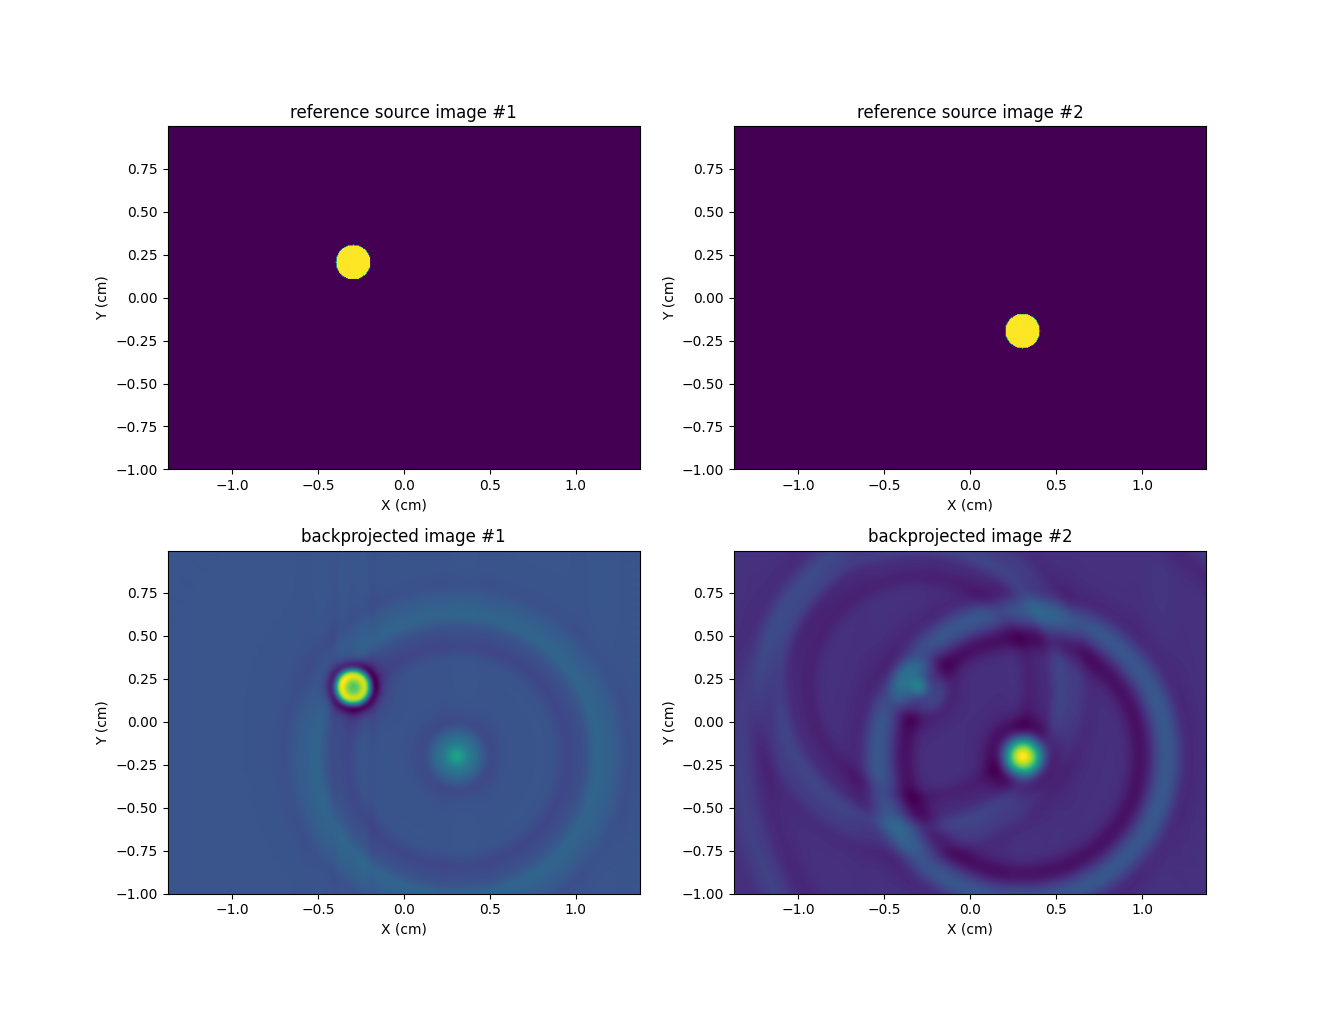
In the multiple EPR sources framework also, backprojecting the sequence of EPR projections does not lead back to the initial sequence of source images but to a filtering of this sequence. In this particular case, the filtering has two main effects: it generates spatial blur (the two backprojected source images have no sharp edges) and mixing of the EPR source images (some signal coming from source #2 is present in the backprojected source image #1 and reciprocally). For a proper inversion in such framework, we refer the reader to the sources separation examples.
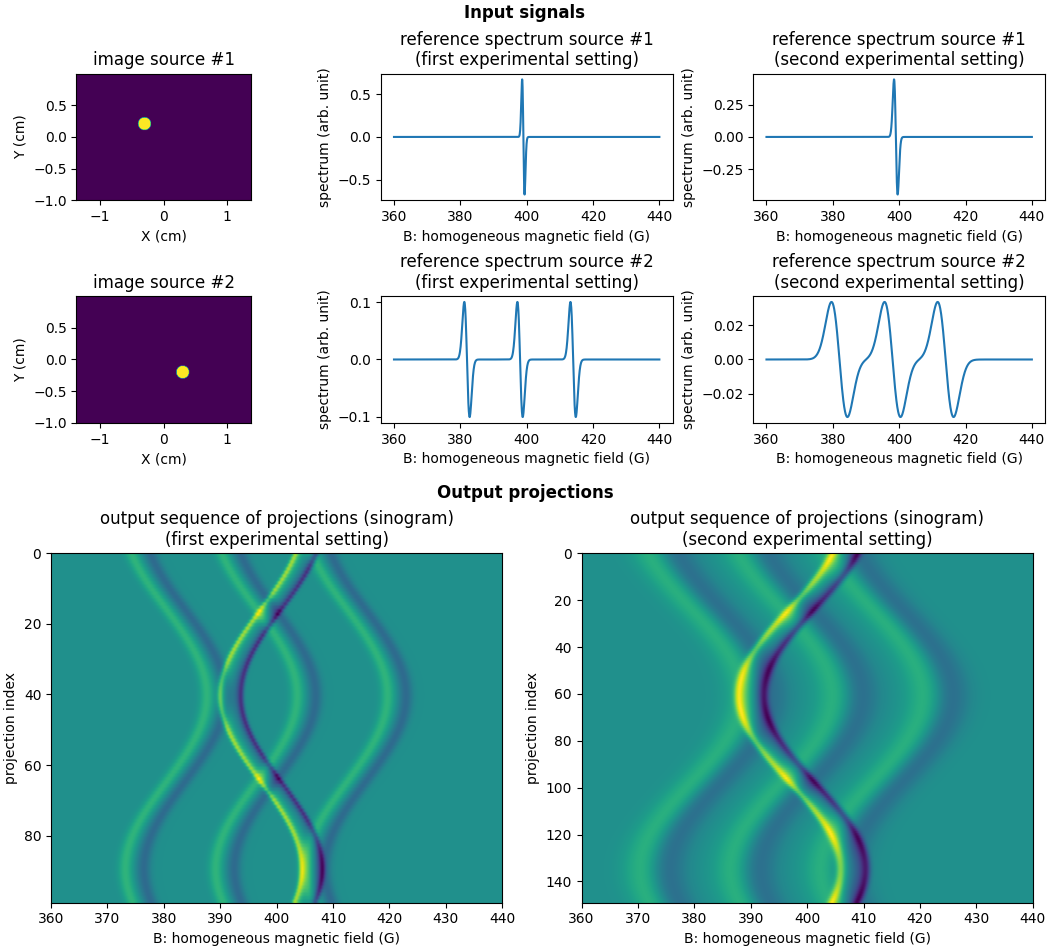
As we illustrated in the projection examples, the projection functions of the PyEPRI package allow the synthesis at once of EPR projections resulting from multiple experimental conditions (provided that the reference spectra of each individual EPR source is provided for each experimental condition). By adjointness, the backprojection operation can take as input EPR projections corresponding to multiple experimental conditions as we shall illustrate now.
First, let us use the pyepri.multisrc.proj2d() function to
generate two sequences of EPR projections acquired in two
(simulated) different experimental settings (we simulate a change of
microwave power between the two acquisitions, for sake of
simplification, the effect of this change is reduced to a dilatation
of the reference spectra of the individual sources between one
acquisition and the other).
# ------------------------------------------------------------------ #
# Compute synthetic image of the first EPR source (one disk) and its #
# associated reference spectrum (one single line) in two different   #
# experimental settings                                              #
# ------------------------------------------------------------------ #

# synthetic 2D image of the first EPR source (disk)
dtype = 'float32'
delta = 5e-3 # sampling step (cm)
Nx, Ny = 550, 400 # image size
xgrid = (-(Nx//2) + backend.arange(Nx, dtype=dtype)) * delta # sampling grid along the X-axis
ygrid = (-(Ny//2) + backend.arange(Ny, dtype=dtype)) * delta # sampling grid along the Y-axis
X, Y = backend.meshgrid(xgrid, ygrid) # spatial sampling grid
u1 = backend.cast(((X + .3)**2 + (Y - .2)**2 <= .1**2), dtype)
u1 /= (delta ** 2) * u1.sum()

# synthetic reference spectrum of the first EPR source (one line
# spectrum synthesized as the derivative of a Gaussian function) in
# the first experimental setting
B = backend.linspace(360, 440, 1200, dtype=dtype)
Br1 = 399
sig1_exp1 = .36
cof1_exp1 = 1. / (sig1_exp1 * math.sqrt(2. * math.pi))
h1_exp1 = - cof1_exp1 * (B - Br1) / sig1_exp1**2 * backend.exp(- (B - Br1)**2 / (2. * sig1_exp1**2))

# synthetic reference spectrum of the first EPR source in the second
# experimental setting (dilatation)
sig1_exp2 = 1.5 * sig1_exp1
cof1_exp2 = 1. / (sig1_exp2 * math.sqrt(2. * math.pi))
h1_exp2 = - cof1_exp2 * (B - Br1) / sig1_exp2**2 * backend.exp(- (B - Br1)**2 / (2. * sig1_exp2**2))

# --------------------------------------------------------------- #
# Compute synthetic image of the second EPR source (another disk) #
# and its associated reference spectrum (three lines spectrum)    #
# --------------------------------------------------------------- #

# synthetic 2D image of the second EPR source (disk)
u2 = backend.cast(((X - .3)**2 + (Y + .2)**2 <= .1**2), dtype)
u2 /= (delta ** 2) * u2.sum()

# synthetic reference spectrum of the second EPR source (three line
# spectrum computed by summing shifted Gaussian derivatives) in the
# first experimental setting
Br2_left = 382
Br2_middle = 398
Br2_right = 414
sig2_exp1 = .8
cof2_exp1 = 1. / (3. * sig2_exp1 * math.sqrt(2. * math.pi))
h2_left_exp1 = - cof2_exp1 * (B - Br2_left) / sig2_exp1**2 * backend.exp(- (B - Br2_left)**2 / (2. * sig2_exp1**2))
h2_middle_exp1 = - cof2_exp1 * (B - Br2_middle) / sig2_exp1**2 * backend.exp(- (B - Br2_middle)**2 / (2. * sig2_exp1**2))
h2_right_exp1 = - cof2_exp1 * (B - Br2_right) / sig2_exp1**2 * backend.exp(- (B - Br2_right)**2 / (2. * sig2_exp1**2))
h2_exp1 = h2_left_exp1 + h2_middle_exp1 + h2_right_exp1

# synthetic reference spectrum of the second EPR source in the second
# experimental setting
sig2_exp2 = 3. * sig2_exp1
cof2_exp2 = 1. / (3. * sig2_exp2 * math.sqrt(2. * math.pi))
h2_left_exp2 = - cof2_exp2 * (B - Br2_left) / sig2_exp2**2 * backend.exp(- (B - Br2_left)**2 / (2. * sig2_exp2**2))
h2_middle_exp2 = - cof2_exp2 * (B - Br2_middle) / sig2_exp2**2 * backend.exp(- (B - Br2_middle)**2 / (2. * sig2_exp2**2))
h2_right_exp2 = - cof2_exp2 * (B - Br2_right) / sig2_exp2**2 * backend.exp(- (B - Br2_right)**2 / (2. * sig2_exp2**2))
h2_exp2 = h2_left_exp2 + h2_middle_exp2 + h2_right_exp2

# --------------------------------------------------------------- #
# Compute field gradient vector coordinates for each experimental #
# setting                                                         #
# --------------------------------------------------------------- #

# first experimental setting
theta_exp1 = backend.linspace(0, 2. * math.pi, 100, dtype=dtype) # field gradient orientations
mu_exp1 = 20 # field gradient amplitude (G/cm)
gx_exp1 = mu_exp1 * backend.cos(theta_exp1) # X-axis coordinates of the field gradient vectors
gy_exp1 = mu_exp1 * backend.sin(theta_exp1) # Y-axis coordinates of the field gradient vectors
fgrad_exp1 = backend.stack((gx_exp1, gy_exp1))

# second experimental setting (field gradient vector coordinates can
# change from one experimental setting to another), we perform a
# slight change here for demonstration purpose
theta_exp2 = backend.linspace(0, 2. * math.pi, 150, dtype=dtype) # field gradient orientations
mu_exp2 = 25 # field gradient amplitude (G/cm)
gx_exp2 = mu_exp2 * backend.cos(theta_exp2) # X-axis coordinates of the field gradient vectors
gy_exp2 = mu_exp2 * backend.sin(theta_exp2) # Y-axis coordinates of the field gradient vectors
fgrad_exp2 = backend.stack((gx_exp2, gy_exp2))

# --------------------------------------------------- #
# Compute projections of the multisources EPR mixture #
# --------------------------------------------------- #
h = ((h1_exp1, h2_exp1), # EPR spectra of the individual sources in the first experimental setting
     (h1_exp2, h2_exp2)) # EPR spectra of the individual sources in the second experimental setting
fgrad = (fgrad_exp1, # field gradient vector coordinates in the first experimental setting
         fgrad_exp2) # field gradient vector coordinates in the second experimental setting
proj = multisrc.proj2d((u1, u2), delta, B, h, fgrad, backend=backend)
proj_exp1 = proj[0] # computed projections for the first experimental setting
proj_exp2 = proj[1] # computed projections for the second experimental setting

# ------------------------------------------ #
# Display input signals & output projections #
# ------------------------------------------ #

# prepare display
fig = plt.figure(layout='constrained', figsize=(10.5, 9.5))
subfigs = fig.subfigures(2, 1)
ax_top = subfigs[0].subplots(2, 3)
ax_bot = subfigs[1].subplots(1, 2)
subfigs[0].suptitle('Input signals', weight='demibold')
subfigs[1].suptitle('Output projections', weight='demibold')

# first EPR source image
extent = [t.item() for t in (xgrid[0], xgrid[-1], ygrid[0], ygrid[-1])]
im1 = ax_top[0][0].imshow(backend.to_numpy(u1), extent=extent, origin='lower')
ax_top[0][0].set_xlabel('X (cm)')
ax_top[0][0].set_ylabel('Y (cm)')
ax_top[0][0].set_title('image source #1')

# second EPR source image
im2 = ax_top[1][0].imshow(backend.to_numpy(u2), extent=extent, origin='lower')
ax_top[1][0].set_xlabel('X (cm)')
ax_top[1][0].set_ylabel('Y (cm)')
ax_top[1][0].set_title('image source #2')

# first EPR source reference spectrum (first experimental setting)
ax_top[0][1].plot(backend.to_numpy(B), backend.to_numpy(h1_exp1))
ax_top[0][1].set_xlabel('B: homogeneous magnetic field (G)')
ax_top[0][1].set_ylabel('spectrum (arb. unit)')
ax_top[0][1].set_title('reference spectrum source #1\n(first experimental setting)')

# first EPR source reference spectrum (second experimental setting)
ax_top[0][2].plot(backend.to_numpy(B), backend.to_numpy(h1_exp2))
ax_top[0][2].set_xlabel('B: homogeneous magnetic field (G)')
ax_top[0][2].set_ylabel('spectrum (arb. unit)')
ax_top[0][2].set_title('reference spectrum source #1\n(second experimental setting)')

# second EPR source reference spectrum (first experimental setting)
ax_top[1][1].plot(backend.to_numpy(B), backend.to_numpy(h2_exp1))
ax_top[1][1].set_xlabel('B: homogeneous magnetic field (G)')
ax_top[1][1].set_ylabel('spectrum (arb. unit)')
ax_top[1][1].set_title('reference spectrum source #2\n(first experimental setting)')

# second EPR source reference spectrum (second experimental setting)
ax_top[1][2].plot(backend.to_numpy(B), backend.to_numpy(h2_exp2))
ax_top[1][2].set_xlabel('B: homogeneous magnetic field (G)')
ax_top[1][2].set_ylabel('spectrum (arb. unit)')
ax_top[1][2].set_title('reference spectrum source #2\n(second experimental setting)')

# computed projection (first experimental setting)s
extent = (B[0].item(), B[-1].item(), proj_exp1.shape[0] - 1, 0)
ax_bot[0].imshow(backend.to_numpy(proj_exp1), extent=extent, aspect='auto')
ax_bot[0].set_xlabel('B: homogeneous magnetic field (G)')
ax_bot[0].set_ylabel('projection index')
ax_bot[0].set_title('output sequence of projections (sinogram)\n(first experimental setting)')

# computed projection (second experimental setting)s
extent = (B[0].item(), B[-1].item(), proj_exp2.shape[0] - 1, 0)
ax_bot[1].imshow(backend.to_numpy(proj_exp2), extent=extent, aspect='auto')
ax_bot[1].set_xlabel('B: homogeneous magnetic field (G)')
ax_bot[1].set_ylabel('projection index')
_ = ax_bot[1].set_title('output sequence of projections (sinogram)\n(second experimental setting)')
Now, let us backproject the whole sequence of EPR projections and display the output images.
# --------------------------------------------------------------- #
# Perform backprojection of the whole sequence of EPR projections #
# --------------------------------------------------------------- #
out_shape_src1 = (Ny, Nx)
out_shape_src2 = (Ny, Nx)
out_shape = (out_shape_src1, out_shape_src2)
out = multisrc.backproj2d(proj, delta, B, h, fgrad, out_shape, backend=backend)

# ------------------------- #
# Display the output images #
# ------------------------- #

# backprojected source image #1
plt.figure(figsize=(13.4, 5.))
plt.subplot(1, 2, 1)
plt.imshow(backend.to_numpy(out[0]), extent=extent, origin='lower', aspect='auto')
plt.xlabel('X (cm)')
plt.ylabel('Y (cm)')
plt.title('backprojected image #1')

# backprojected source image #2
plt.subplot(1, 2, 2)
plt.imshow(backend.to_numpy(out[1]), extent=extent, origin='lower', aspect='auto')
plt.xlabel('X (cm)')
plt.ylabel('Y (cm)')
_ = plt.title('backprojected image #2')
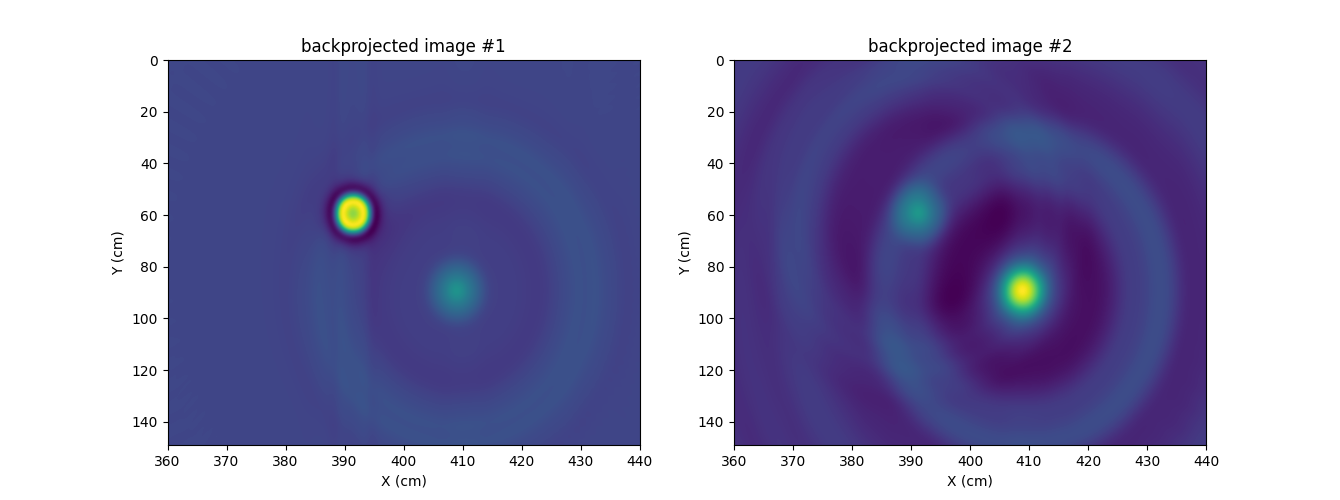
There is nothing particularly new to conclude from this experiment
except that the pyepri.multisrc.backproj2d() is able to
deal with input EPR projections coming from multiple experimental
settings. This backprojection operation still not corresponds to the
inverse of the projection operation (the returned source images
substantially differ from the reference source images). However,
this backprojection operation can be used in more advanced
reconstruction algorithms (for instance, based on variational
models) that would explicitly require to evaluate the adjoint of the
projection operation.
Multiple EPR sources (3D setting)
In this last example, let us compute EPR projections from two three-dimensional EPR sources images, then let us perform the associated backprojection operation. First, let us synthesize the two source images.
# ---------------------------------------------------- #
# Compute a synthetic 3D images of the two EPR sources #
# ---------------------------------------------------- #

# compute sampling grids (the two sources images must share the same
# sampling step but can have different size, although we will use here
# the same size for both images)
Nx, Ny, Nz = 128, 256, 128 # image dimensions
delta = .02 # spatial sampling step (cm)
xgrid = (-(Nx//2) + backend.arange(Nx, dtype=dtype)) * delta
ygrid = (-(Ny//2) + backend.arange(Ny, dtype=dtype)) * delta
zgrid = (-(Nz//2) + backend.arange(Nz, dtype=dtype)) * delta
X, Y, Z = backend.meshgrid(xgrid, ygrid, zgrid)

# first source image (ellipsoid)
v_src1 = backend.cast(((X - .4) / .25)**2 + ((Y - .1) / .7)**2 + (((Z - .4) / .25)**2) <= 1., dtype=dtype)
v_src1 /= (delta**3 * v_src1.sum())

# second source image (another ellipsoid)
v_src2 = backend.cast(((X + .4) / .25)**2 + ((Y + .1) / .9)**2 + (((Z + .4) / .25)**2) <= 1., dtype=dtype)
v_src2 /= (delta**3 * v_src2.sum())

# ----------------------------------- #
# Display input 3D image (isosurface) #
# ----------------------------------- #

# compute isosurface sampling grid
grid = pv.StructuredGrid(backend.to_numpy(X), backend.to_numpy(Y), backend.to_numpy(Z))

# compute isosurface for the first source image
vol = np.moveaxis(backend.to_numpy(v_src1), (0,1,2), (2,1,0))
grid["vol"] = vol.flatten()
l1 = vol.max()
l0 = .2 * l1
isolevels = np.linspace(l0, l1, 10)
contours_src1 = grid.contour(isolevels)

# compute isosurface for the second source image
vol = np.moveaxis(backend.to_numpy(v_src2), (0,1,2), (2,1,0))
grid["vol"] = vol.flatten()
l1 = vol.max()
l0 = .2 * l1
isolevels = np.linspace(l0, l1, 10)
contours_src2 = grid.contour(isolevels)

# display isosurfaces
cpos = [(-3.8, 4.35, 2.11), (0.0, -0.1, 0.0), (-0.33, -0.62, 0.71)]
p = pv.Plotter()
p.camera_position = cpos
labels = dict(ztitle='Z', xtitle='X', ytitle='Y')
p.add_mesh(contours_src1, show_scalar_bar=False, color='#db0404', label=' source #1')
p.add_mesh(contours_src2, show_scalar_bar=False, color='#01b517', label=' source #2')
p.show_grid(**labels)
p.add_legend(face='r')
p.show()
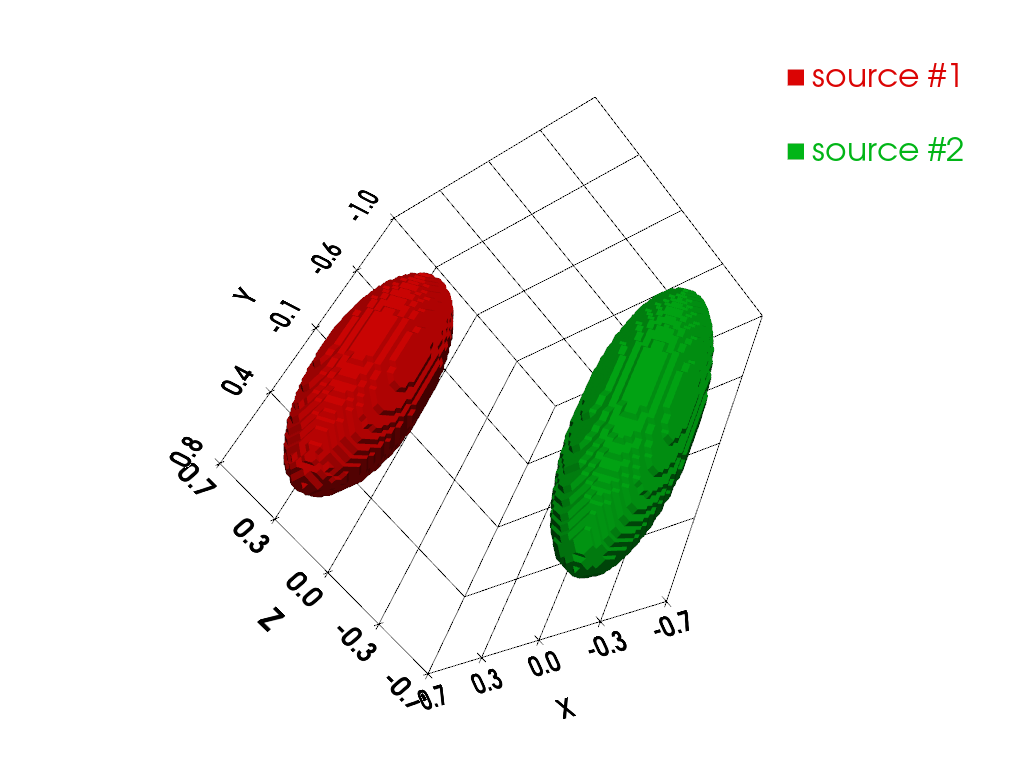
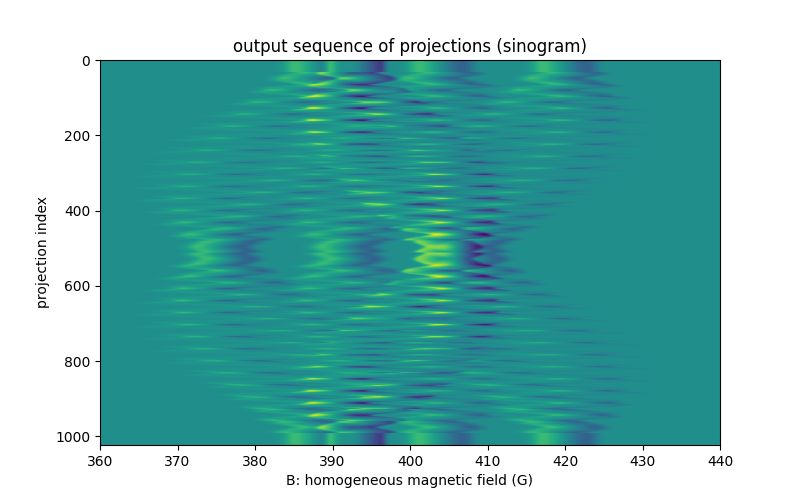
Next, let us compute and display the synthetic reference spectra of the two EPR sources, the field gradient orientations to use to generate the projections, and the projections.
# ----------------------------------------------------------------- #
# Compute synthetic reference spectrum of the first EPR source (one #
# line spectrum)                                                    #
# ----------------------------------------------------------------- #
B = backend.linspace(360, 440, 1200, dtype=dtype)
Br1 = 399
sig1 = .36
cof1 = 1. / (sig1 * math.sqrt(2. * math.pi))
h1 = - cof1 * (B - Br1) / sig1**2 * backend.exp(- (B - Br1)**2 / (2. * sig1**2))

# -------------------------------------------------------------------- #
# Compute synthetic reference spectrum of the second EPR source (three #
# lines spectrum)                                                      #
# -------------------------------------------------------------------- #
Br2_left = 382
Br2_middle = 398
Br2_right = 414
sig2 = .8
cof2 = 1. / (3. * sig2 * math.sqrt(2. * math.pi))
h2_left = - cof2 * (B - Br2_left) / sig2**2 * backend.exp(- (B - Br2_left)**2 / (2. * sig2**2))
h2_middle = - cof2 * (B - Br2_middle) / sig2**2 * backend.exp(- (B - Br2_middle)**2 / (2. * sig2**2))
h2_right = - cof2 * (B - Br2_right) / sig2**2 * backend.exp(- (B - Br2_right)**2 / (2. * sig2**2))
h2 = h2_left + h2_middle + h2_right

# ------------------------------------------ #
# Compute field gradient vectors coordinates #
# ------------------------------------------ #
t1 = backend.linspace(0, 2. * math.pi, 32, dtype=dtype)
t2 = backend.linspace(0, 2. * math.pi, 32, dtype=dtype)
theta1, theta2 = backend.meshgrid(t1, t2)
theta1 = theta1.reshape((-1,)) # polar angles of the field gradients
theta2 = theta2.reshape((-1,)) # azimuthal angles of the field gradients
mu = 15 # field gradient amplitude (G/cm)
gx = mu * backend.cos(theta1) * backend.sin(theta2) # X-axis coordinates of the field gradient vectors
gy = mu * backend.sin(theta1) * backend.sin(theta2) # Y-axis coordinates of the field gradient vectors
gz = mu * backend.cos(theta2) # Z-axis coordinates of the field gradient vectors
fgrad = backend.stack((gx, gy, gz))

# ----------------------------------------------------- #
# Compute the projections of the mixture of EPR sources #
# ----------------------------------------------------- #
proj = multisrc.proj3d((v_src1, v_src2), delta, B, ((h1, h2),), (fgrad,), backend=backend)

# ---------------------------------------------------- #
# Display reference spectra and field gradient vectors #
# ---------------------------------------------------- #

# reference spectrum of the first EPR source
fig = plt.figure(figsize=(15, 4.))
fig.add_subplot(1, 3, 1)
plt.plot(backend.to_numpy(B), backend.to_numpy(h1))
plt.grid(linestyle=':')
plt.xlabel('B: homogeneous magnetic field (G)')
plt.ylabel('spectrum (arb. unit)')
plt.title('reference spectrum source #1')

# reference spectrum of the second EPR source
fig.add_subplot(1, 3, 2)
plt.plot(backend.to_numpy(B), backend.to_numpy(h2))
plt.grid(linestyle=':')
plt.xlabel('B: homogeneous magnetic field (G)')
#plt.ylabel('spectrum (arb. unit)')
plt.title('reference spectrum source #2')

# magnetic field gradient vectors
ax = fig.add_subplot(1, 3, 3, projection='3d')
ax.scatter(backend.to_numpy(fgrad[0]), backend.to_numpy(fgrad[1]), backend.to_numpy(fgrad[2]))
ax.set_xlabel('X (cm)')
ax.set_ylabel('Y (cm)')
ax.set_zlabel('Z (cm)')
ax.set_aspect('equal', 'box')
_ = plt.title('magnetic field gradient samples')

# -------------------------------- #
# Display the computed projections #
# -------------------------------- #
plt.figure(figsize=(8., 5.))
extent = (B[0].item(), B[-1].item(), proj[0].shape[0] - 1, 0)
plt.imshow(backend.to_numpy(proj[0]), extent=extent, aspect='auto')
plt.xlabel('B: homogeneous magnetic field (G)')
plt.ylabel('projection index')
_ = plt.title('output sequence of projections (sinogram)')
Now, let us perform the backprojection operation and display the central ZX slice of the backprojected source images.
#-----------------------------------------------------------#
# Perform backprojection of the sequence of EPR projections #
#-----------------------------------------------------------#
out_shape_src1 = (Ny, Nx, Nz)
out_shape_src2 = (Ny, Nx, Nz)
out_shape = (out_shape_src1, out_shape_src2)
out = multisrc.backproj3d(proj, delta, B, ((h1, h2),), (fgrad,), out_shape, backend=backend)

#--------------------------------------------------------------------------#
# display central XZ slice (Y = 0) of the reference & backprojected images #
#--------------------------------------------------------------------------#

# reference source image #1
plt.figure(figsize=(11., 11.))
plt.subplot(2, 2, 1)
extent = [t.item() for t in (xgrid[0], xgrid[-1], zgrid[0], zgrid[-1])]
plt.imshow(backend.to_numpy(v_src1[Ny//2, :, :]), extent=extent, origin='lower')
plt.xlabel('X (cm)')
plt.ylabel('Z (cm)')
plt.title('ref. source image #1 (ZX slice, Y = %g)' % ygrid[Ny//2].item())

# reference source image #2
plt.subplot(2, 2, 2)
plt.imshow(backend.to_numpy(v_src2[Ny//2, :, :]), extent=extent, origin='lower')
plt.xlabel('X (cm)')
plt.ylabel('Z (cm)')
plt.title('ref. source image #2 (ZX slice, Y = %g)' % ygrid[Ny//2].item())

# backprojected source image #1
plt.subplot(2, 2, 3)
plt.imshow(backend.to_numpy(out[0][Ny//2, :, :]), extent=extent, origin='lower')
plt.xlabel('X (cm)')
plt.ylabel('Z (cm)')
plt.title('backprojected image #1 (ZX slice, Y = %g)' % ygrid[Ny//2].item())

# backprojected source image #2
plt.subplot(2, 2, 4)
plt.imshow(backend.to_numpy(out[1][Ny//2, :, :]), extent=extent, origin='lower')
plt.xlabel('X (cm)')
plt.ylabel('Z (cm)')
_ = plt.title('backprojected image #2 (ZX slice, Y = %g)' % ygrid[Ny//2].item())
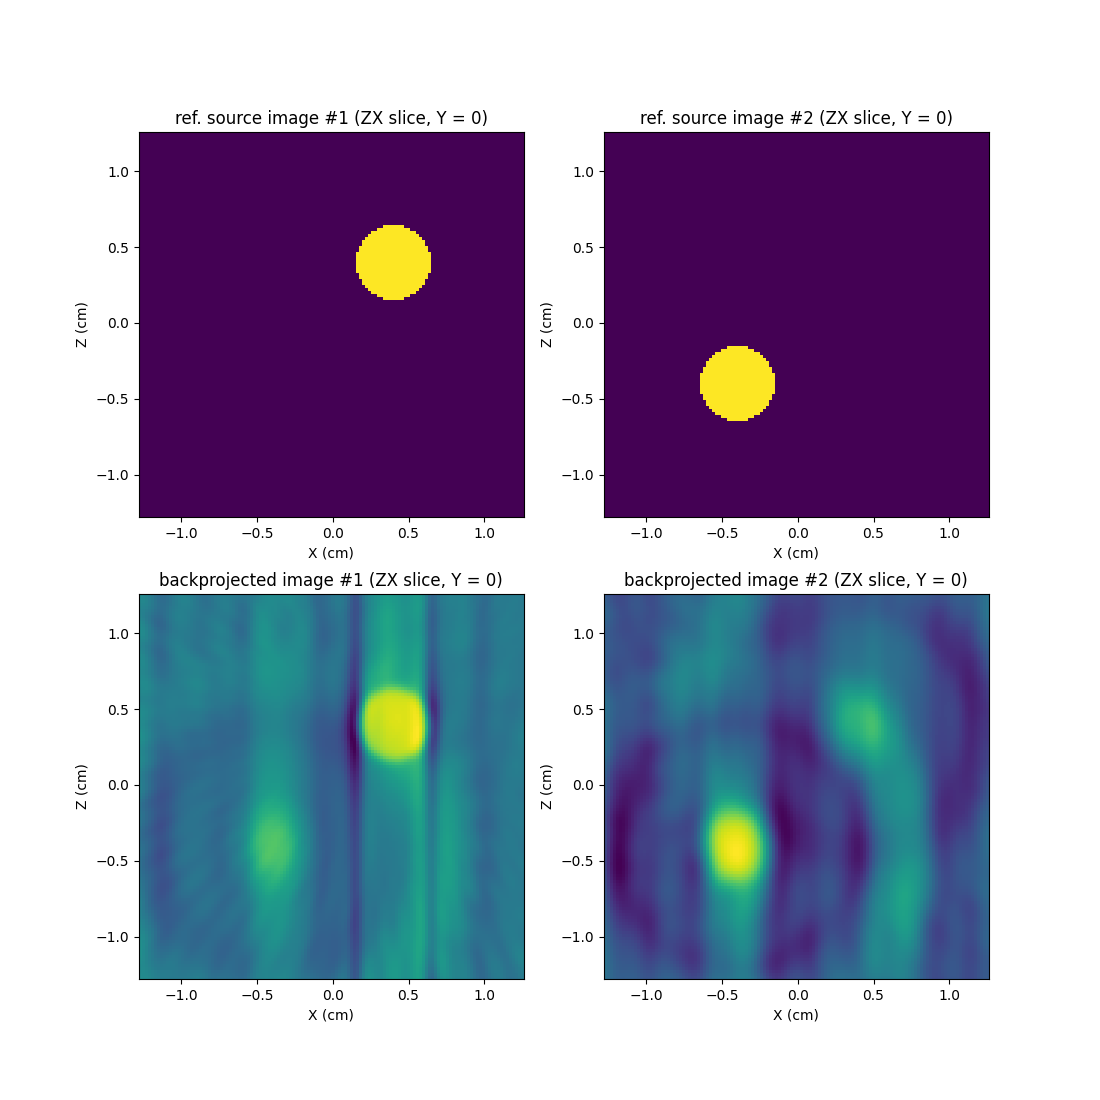
As usual, projection followed by backprojection yields a filtered version of the initial (reference) images. We won’t display here isosurfaces of the reconstructed volumes since there is nothing special to see.
Backprojection of sequences of sinograms: as we illustrated in
the 2D setting, the pyepri.multisrc.backproj3d() function is
able to process a sequence of sinograms acquired in various
experimental conditions.
Next (Toeplitz kernels): the application of a projection operator \(A\) followed by the application of its adjoint \(A^*\) (= backprojection) is equivalent to the application of a Toeplitz circulant operator whose evaluation can be done using convolution and is in general more efficient than the successive application of \(A\) then \(A^*\). The fast evaluation of \(A^*A\) using convolution is the topic of the next tutorial.
Total running time of the script: (0 minutes 6.505 seconds)
Estimated memory usage: 516 MB
