Note
Go to the end to download the full example code.
Toeplitz kernels
Efficient evaluation of a projection operation followed by a backprojection operation using Toeplitz kernels.
In the two previous tutorials, we presented the projection and backprojection operators implemented in the PyEPRI package. As we explained, those operators are linear mapping that are adjoint to each other.
We recall below the projection (\(A\)) and corresponding backprojection (\(A^*\)) operators implemented in the PyEPRI package. We refer to the Mathematical definitions section of the documentation for the formal description of those operators.
Projection operator \(A\) |
Adjoint (= backprojection) operator \(A^*\) |
|---|---|
In some situations, we may be interested in performing consecutively a projection and a backprojection operation, that corresponds to the evaluation of the \(A^* \circ A\) operator. We explained in the Mathematical definitions section of the PyEPRI documentation that such projection-backprojection operation can be evaluated by means of one (in the monosource framework) or several (in the multisources framework) convolution between the input image and one or several kernels. The underlying reason is that the \(A^* \circ A\) exhibits a Toeplitz in the monosource setting and a block-Toeplitz structure in the multisources setting.
In applications when several (typically more than two) evaluations of the \(A^* \circ A\) operator are needed, the computation of the projection-backprojection operations by means of convolutions must be preferred to the successive evaluation of the projection (using \(A\)) followed by the backprojection (using \(A^*\)) operation. Indeed, the convolution kernel mentioned above (that will be referred as the Toeplitz kernel in the monosource framework and the cross sources Toeplitz kernels in the multisources framework), and more importantly, their discrete Fourier coefficients, can be computed once and for all, and used each time the evaluation of \(A^* \circ A\) is needed. Combined with the use of the FFT Algorithm for the fast computation of the convolutions, this approach is numerically very efficient.
Two typical examples where this numerical trick reveals its power will be presented in upcoming examples, and corresponds to the total variation based EPR image reconstruction and EPR source separation examples. Both examples boil down to a regularized least-squares problem which consists in finding a minimizer of an energy \(E\) of the type
(1)\[ E(u) := \frac{1}{2}\|A(u) - s\|_2^2 + R(u)\]
where \(s\) denotes the measurements (sinogram) and \(R\) denotes a regularizer (based on the total variation). Modern algorithms can address such minimization problem using iterative algorithms. A class of algorithms particularly well suited to the minimization of (1) involve, at each iteration, the evaluation of the gradient of the least-squares term \(F(u) := \frac{1}{2} \|A(u) - s\|_2^2\), which is none other than \(\nabla F(u) = A^* \circ A (u) - A^*(s)\). since \(A^*(s)\) never changes, it can be computed once and for all, then the multiple evaluations of \(A^* \circ A\) along the algorithm iterations can be handled efficiently using Toeplitz kernels.
In this tutorial, we will explain how the Toeplitz kernels involved in the fast evaluation of projection-backprojection operations can be computed and used.
Single EPR source (2D setting)
Let us generate a synthetic two-dimensional image and a synthetic reference spectrum.
# -------------- #
# Import modules #
# -------------- #
import math
import matplotlib.pyplot as plt
import numpy as np
import pyepri.backends as backends
import pyepri.displayers as displayers
import pyepri.monosrc as monosrc
import pyepri.multisrc as multisrc
import pyvista as pv
plt.ion()

# -------------- #
# Create backend #
# -------------- #
#
# You can uncomment one line below to select another backend (if
# installed on your system).
#
backend = backends.create_numpy_backend()
#backend = backends.create_torch_backend('cpu') # uncomment here for torch-cpu backend
#backend = backends.create_cupy_backend() # uncomment here for cupy backend
#backend = backends.create_torch_backend('cuda') # uncomment here for torch-gpu backend

# -------------------------------------------------------------- #
# Compute synthetic inputs (2D image, reference spectrum & field #
# gradient vector coordinates)                                   #
# -------------------------------------------------------------- #

# synthetic 2D image
dtype = 'float32'
delta = 5e-3 # sampling step (cm)
Nx, Ny = 550, 400 # image size
xgrid = (-(Nx//2) + backend.arange(Nx, dtype=dtype)) * delta # sampling grid along the X-axis
ygrid = (-(Ny//2) + backend.arange(Ny, dtype=dtype)) * delta # sampling grid along the Y-axis
X, Y = backend.meshgrid(xgrid, ygrid) # spatial sampling grid
u1 = backend.cast(((X - .2)**2 + (Y + .2)**2 <= .08**2), dtype)
u2 = backend.cast((X + .2)**2 + (Y - .2)**2 <= .08**2, dtype)
u3 = backend.cast((X + .2)**2 + (Y + .2)**2 <= .05**2, dtype)
u4 = backend.cast((X - .2)**2 + (Y - .2)**2 <= .05**2, dtype)
u = u1 + u2 + u3 + u4
u /= (delta ** 2) * u.sum()

# synthetic reference spectrum (simple Gaussian derivative)
B = backend.linspace(380, 420, 512, dtype=dtype)
Br = 400
sig = .3
cof = 1. / (sig * math.sqrt(2. * math.pi))
h = - cof * (B - Br) / sig**2 * backend.exp(- (B - Br)**2 / (2. * sig**2))

# field gradient vector coordinates (one vector per projection to
# compute)
theta = backend.linspace(0, 2. * math.pi, 100, dtype=dtype) # field gradient orientations
mu = 20 # field gradient amplitude (G/cm)
gx = mu * backend.cos(theta) # X-axis coordinates of the field gradient vectors
gy = mu * backend.sin(theta) # Y-axis coordinates of the field gradient vectors
fgrad = backend.stack((gx, gy))

# ---------------------- #
# Display signals (u, h) #
# ---------------------- #

# input image
plt.figure(figsize=(13.6, 4.2))
plt.subplot(1, 2, 1)
extent = [t.item() for t in (xgrid[0], xgrid[-1], ygrid[0], ygrid[-1])]
plt.imshow(backend.to_numpy(u), extent=extent, origin='lower')
plt.xlabel('X (cm)')
plt.ylabel('Y (cm)')
plt.title('input image')

# input reference spectrum
plt.subplot(1, 2, 2)
plt.plot(backend.to_numpy(B), backend.to_numpy(h))
plt.grid(linestyle=':')
plt.xlabel('B: homogeneous magnetic field (G)')
plt.ylabel('spectrum (arb. unit)')
_ = plt.title('input reference spectrum')

Next, let us create the Toeplitz kernel associated to the evaluation
of \(A^* \circ A\) (here, \(A\) denotes the projection
operation performed using the pyepri.monosrc.proj2d() function
and \(A^*\) denotes the adjoint of \(A\) and corresponds to
the backprojection operation performed using the
pyepri.monosrc.backproj2d() function).
# ----------------------- #
# Compute Toeplitz kernel #
# ----------------------- #
Nx_ker, Ny_ker = 2*Nx, 2*Ny
ker_shape = (Ny_ker, Nx_ker) # kernel shape must be twice the image shape along each dimension
eps = 1e-6 # requested precision (you should use eps = 1e-16 when dtype is 'float64')
phi = monosrc.compute_2d_toeplitz_kernel(B, h, h, delta, fgrad, ker_shape, eps=eps, backend=backend)

# --------------------------- #
# Display the Toeplitz kernel #
# --------------------------- #

# compute kernel sampling grid
xgrid_ker = (-(Nx_ker//2) + backend.arange(Nx_ker, dtype=dtype)) * delta # sampling grid along the X-axis
ygrid_ker = (-(Ny_ker//2) + backend.arange(Ny_ker, dtype=dtype)) * delta # sampling grid along the Y-axis

# display kernel (use saturation for low/high values)
plt.figure(figsize=(7.8, 4.4))
extent = [t.item() for t in (xgrid_ker[0], xgrid_ker[-1], ygrid_ker[0], ygrid_ker[-1])]
im_hdl = plt.imshow(backend.to_numpy(phi), extent=extent, origin='lower')
cmin = backend.quantile(phi, .05) # saturate 5% of the smallest values
cmax = backend.quantile(phi, .95) # saturate 5% of the highest values
im_hdl.set_clim(cmin.item(), cmax.item())
plt.colorbar()
plt.xlabel("X (cm)")
plt.ylabel("Y (cm)")
_ = plt.title("Toeplitz kernel")
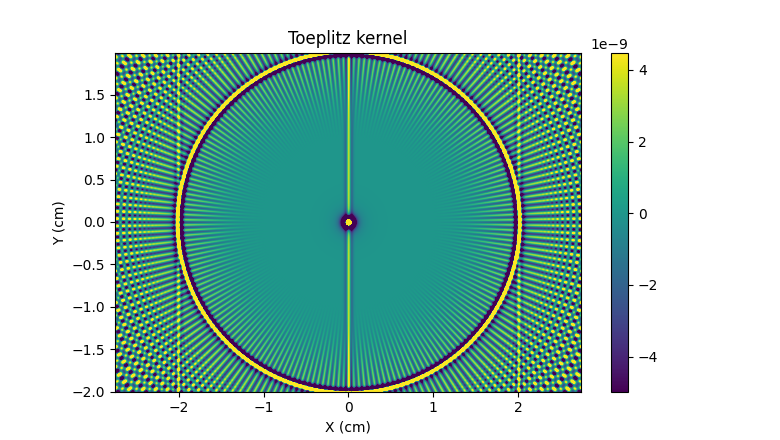
Now let us show how to use this kernel to apply the projection-backprojection operation \(A^* \circ A\) to the input image \(u\) defined above.
# --------------------------------------------------- #
# Fast evaluation of A*A(u) using the Toeplitz kernel #
# --------------------------------------------------- #
rfft2_phi = backend.rfft2(phi)
out = monosrc.apply_2d_toeplitz_kernel(u, rfft2_phi, backend=backend)

# -------------------------------------------------------------------- #
# Compute A*A(u) by successive evaluation of A and A* (for comparison) #
# -------------------------------------------------------------------- #
Au = monosrc.proj2d(u, delta, B, h, fgrad, backend=backend)
AstarAu = monosrc.backproj2d(Au, delta, B, h, fgrad, u.shape, backend=backend)

# --------------------------------------------------------- #
# Compare outputs (should be equal up to machine precision) #
# --------------------------------------------------------- #

# display A*A(u) computed by successive evaluation of A and A*
plt.figure(figsize=(14.5, 6.))
plt.subplot(1, 2, 1)
extent = [t.item() for t in (xgrid[0], xgrid[-1], ygrid[0], ygrid[-1])]
plt.imshow(backend.to_numpy(AstarAu), extent=extent, origin='lower')
plt.xlabel('X (cm)')
plt.ylabel('Y (cm)')
plt.title('successive evaluation of A and A*', fontsize=16)

# display A*A(u) computed using the Toeplitz kernel
plt.subplot(1, 2, 2)
plt.imshow(backend.to_numpy(out), extent=extent, origin='lower')
plt.xlabel('X (cm)')
plt.ylabel('Y (cm)')
plt.title('evaluation of A*A using Toeplitz kernel', fontsize=16)

# compute relative error between out and AstarAu
rel = backend.sqrt(((out - AstarAu)**2).sum() / ((AstarAu)**2).sum())
_ = plt.suptitle("Evaluation of A*A(u) using two methods\n(relative error between the two outputs = %.1e in %s precision)" %  (rel, dtype), weight='demibold', fontsize=18)
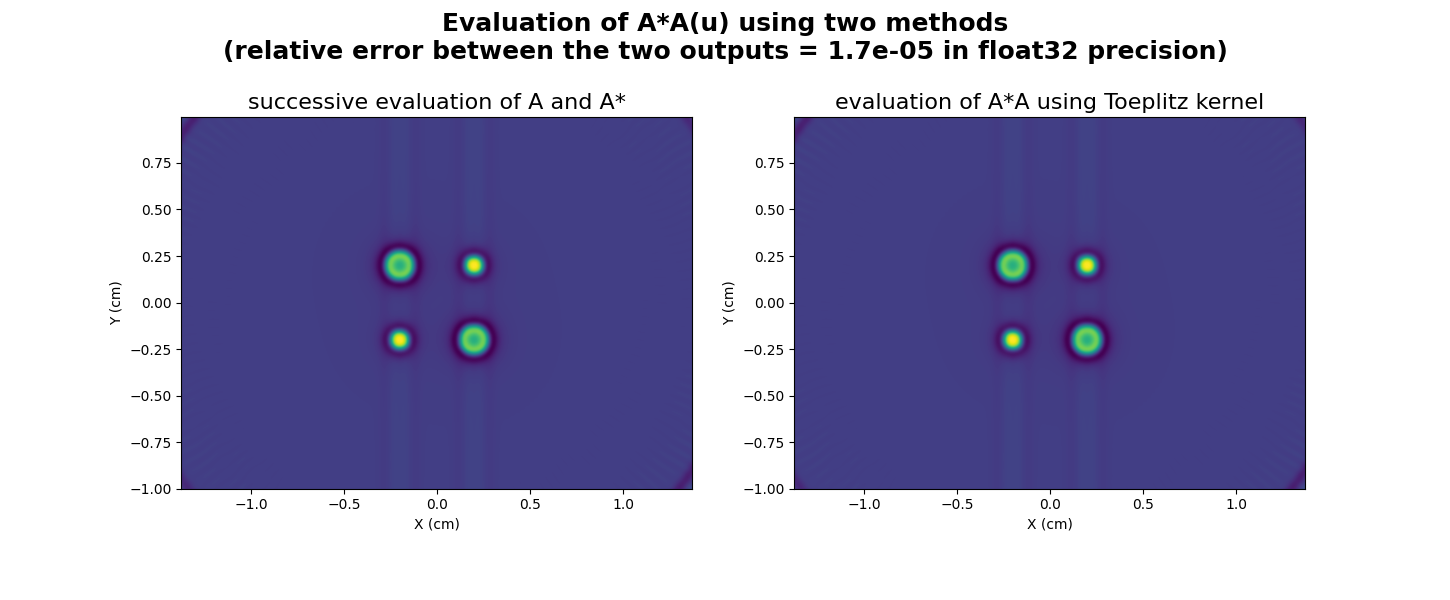
Since the Toeplitz kernel never change, it can be calculated once and for all, and used each time the evaluation of \(A^* \circ A\) is needed.
Note also that you can use the return_rfft2 optional parameter
of pyepri.monosrc.compute_2d_toeplitz_kernel() to return
directly the DFT coefficients of the kernel instead of the kernel
itself:
rfft2_phi = monosrc.compute_2d_toeplitz_kernel(B, h, h, delta, fgrad,
                                               ker_shape,
                                               backend=backend,
                                               eps=eps,
                                               return_rfft2=True)
Then, the evaluation of \(A^* \circ A\) can be carried out as many time as needed using
out = monosrc.apply_2d_toeplitz_kernel(u, rfft2_phi, backend=backend)
Single EPR source (3D setting)
We perform below the same kind of experiment using a three-dimensional setting. First, let us compute a three-dimensional synthetic reference image.
# --------------------------------------------------------- #
# Compute a synthetic 3D input image made of two ellipsoids #
# --------------------------------------------------------- #
Nx, Ny, Nz = 128, 256, 128 # image dimensions
delta = .02 # spatial sampling step (cm)
xgrid = (-(Nx//2) + backend.arange(Nx, dtype=dtype)) * delta
ygrid = (-(Ny//2) + backend.arange(Ny, dtype=dtype)) * delta
zgrid = (-(Nz//2) + backend.arange(Nz, dtype=dtype)) * delta
X, Y, Z = backend.meshgrid(xgrid, ygrid, zgrid)
v1 = (((X - .4) / .25)**2 + ((Y - .1) / .7)**2 + (((Z - .4) / .25)**2) <= 1.)
v2 = (((X + .4) / .25)**2 + ((Y + .1) / .9)**2 + (((Z + .4) / .25)**2) <= 1.)
v = backend.cast(v1, dtype) + backend.cast(v2, dtype)
v /= (delta**3 * v.sum())

# ----------------------------------- #
# Display input 3D image (isosurface) #
# ----------------------------------- #

# compute isosurface sampling grid
grid = pv.StructuredGrid(backend.to_numpy(X), backend.to_numpy(Y), backend.to_numpy(Z))

# compute isosurface
vol = np.moveaxis(backend.to_numpy(v), (0,1,2), (2,1,0))
grid["vol"] = vol.flatten()
l1 = vol.max()
l0 = .2 * l1
isolevels = np.linspace(l0, l1, 10)
contours = grid.contour(isolevels)

# display isosurface
cpos = [(-3.8, 4.35, 2.11), (0.0, -0.1, 0.0), (-0.33, -0.62, 0.71)]
p = pv.Plotter()
p.camera_position = cpos
labels = dict(ztitle='Z', xtitle='X', ytitle='Y')
p.add_mesh(contours, show_scalar_bar=False, color='#f7fe00')
p.show_grid(**labels)
p.show()
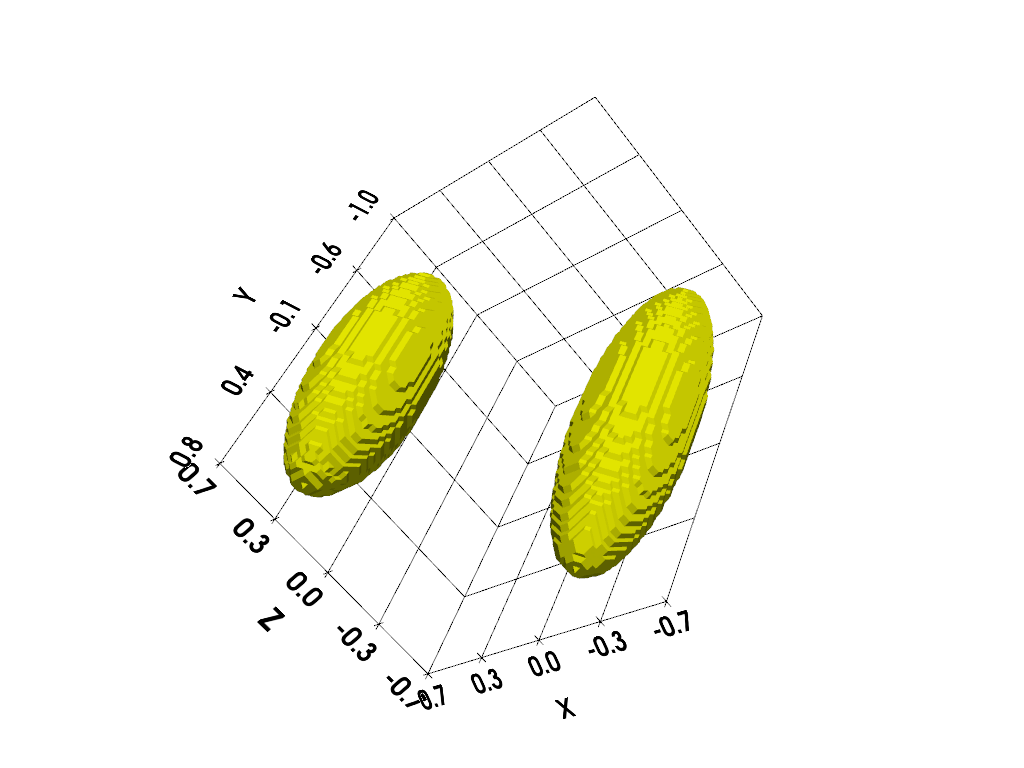
Next, let us compute and display a synthetic reference spectrum and some field gradient vector coordinates.
# ------------------------------------------------------------ #
# Compute synthetic reference spectrum & field gradient vector #
# coordinates                                                  #
# ------------------------------------------------------------ #

# synthetic reference spectrum (simple Gaussian derivative)
B = backend.linspace(370, 430, 512, dtype=dtype)
Br = 400
sig = .3
cof = 1. / (sig * math.sqrt(2. * math.pi))
h = - cof * (B - Br) / sig**2 * backend.exp(- (B - Br)**2 / (2. * sig**2))

# field gradient vector coordinates
t1 = backend.linspace(0, 2. * math.pi, 32, dtype=dtype)
t2 = backend.linspace(0, 2. * math.pi, 32, dtype=dtype)
theta1, theta2 = backend.meshgrid(t1, t2)
theta1 = theta1.reshape((-1,)) # polar angles of the field gradients
theta2 = theta2.reshape((-1,)) # azimuthal angles of the field gradients
mu = 20 # field gradient amplitude (G/cm)
gx = mu * backend.cos(theta1) * backend.sin(theta2) # X-axis coordinates of the field gradient vectors
gy = mu * backend.sin(theta1) * backend.sin(theta2) # Y-axis coordinates of the field gradient vectors
gz = mu * backend.cos(theta2) # Z-axis coordinates of the field gradient vectors
fgrad = backend.stack((gx, gy, gz))

# ------- #
# Display #
# ------- #

# reference spectrum
fig = plt.figure(figsize=(8.8, 4.))
fig.add_subplot(1, 2, 1)
plt.plot(backend.to_numpy(B), backend.to_numpy(h))
plt.grid(linestyle=':')
plt.xlabel('B: homogeneous magnetic field (G)')
plt.ylabel('spectrum (arb. unit)')
plt.title('input reference spectrum')

# magnetic field gradient vectors
ax = fig.add_subplot(1, 2, 2, projection='3d')
ax.scatter(backend.to_numpy(fgrad[0]), backend.to_numpy(fgrad[1]), backend.to_numpy(fgrad[2]))
ax.set_xlabel('X (cm)')
ax.set_ylabel('Y (cm)')
ax.set_zlabel('Z (cm)')
ax.set_aspect('equal', 'box')
_ = plt.title('magnetic field gradient samples')
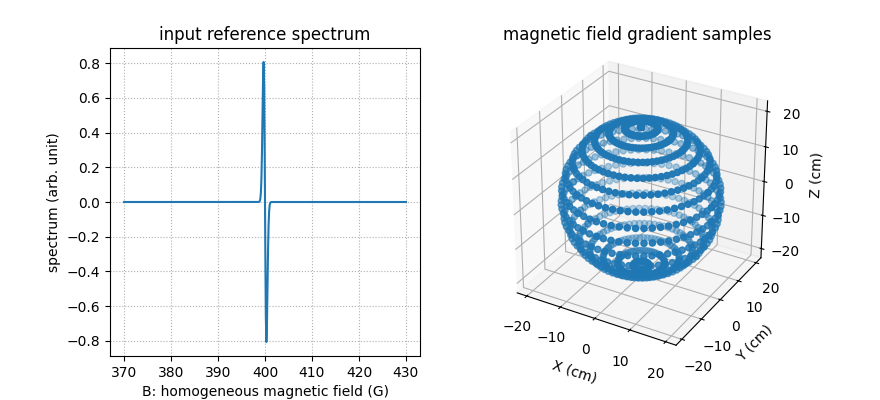
Next, let us create the Toeplitz kernel associated to the evaluation
of \(A^* \circ A\) (here, \(A\) denotes the projection
operation performed using the pyepri.monosrc.proj3d() function
and \(A^*\) denotes the adjoint of \(A\) and corresponds to
the backprojection operation performed using the
pyepri.monosrc.backproj3d() function).
# ----------------------- #
# Compute Toeplitz kernel #
# ----------------------- #
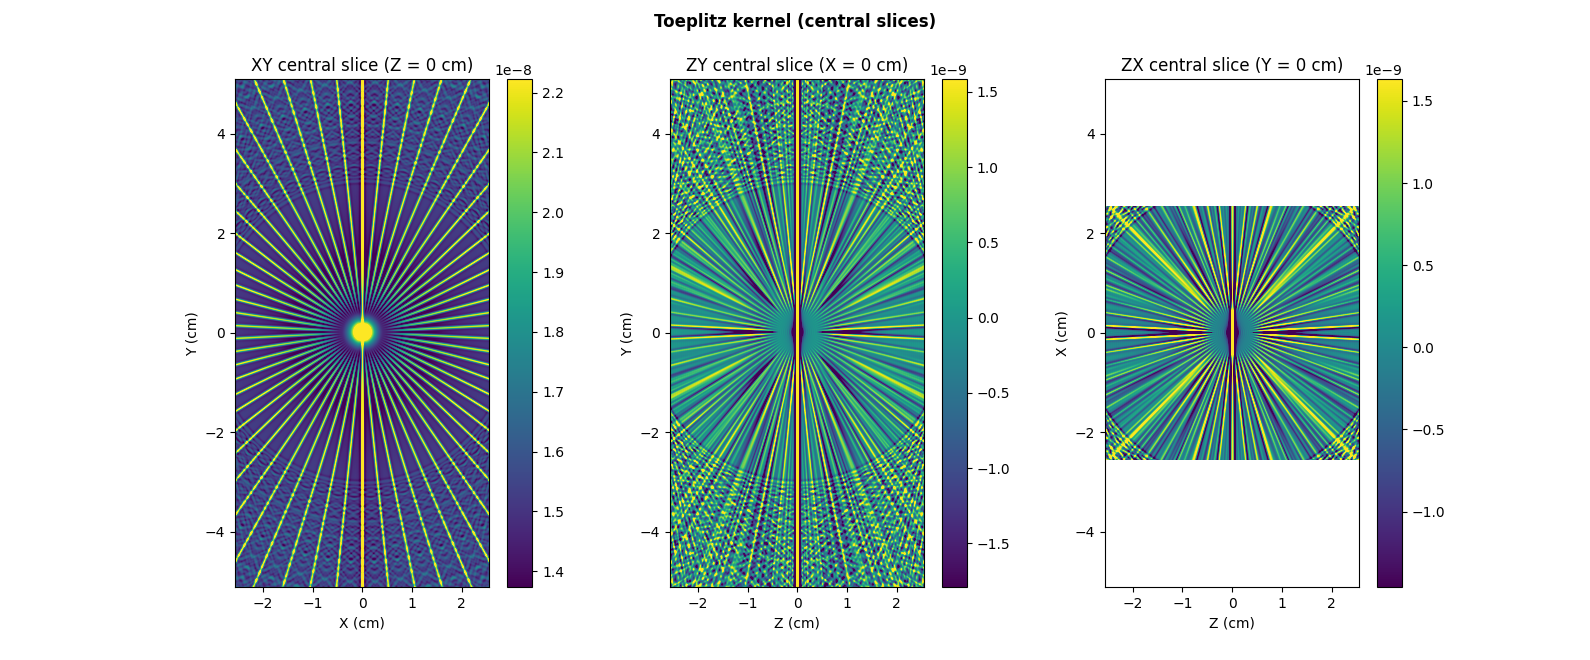
Nx_ker, Ny_ker, Nz_ker = 2*Nx, 2*Ny, 2*Nz
ker_shape = (Ny_ker, Nx_ker, Nz_ker) # kernel shape must be twice the image shape along each dimension
eps = 1e-6 # requested precision (you should use eps = 1e-16 when dtype is 'float64')
phi = monosrc.compute_3d_toeplitz_kernel(B, h, h, delta, fgrad, ker_shape, backend=backend, eps=eps)

# --------------------------------------------- #
# Display central slices of the Toeplitz kernel #
# --------------------------------------------- #

# compute kernel sampling grid
xgrid_ker = (-(Nx_ker//2) + backend.arange(Nx_ker, dtype=dtype)) * delta # sampling grid along the X-axis
ygrid_ker = (-(Ny_ker//2) + backend.arange(Ny_ker, dtype=dtype)) * delta # sampling grid along the Y-axis
zgrid_ker = (-(Nz_ker//2) + backend.arange(Nz_ker, dtype=dtype)) * delta # sampling grid along the Z-axis

# compute boundaries for slice display (use common boundaries to
# ensure common pixel size for all subplots)
xlim = (min(xgrid_ker[0], zgrid_ker[0]).item(), max(xgrid_ker[-1], zgrid_ker[-1]).item())
ylim = (min(xgrid_ker[0], ygrid_ker[0]).item(), max(xgrid_ker[-1], ygrid_ker[-1]).item())

# compute slices
phi_xy = backend.to_numpy(phi[:, :, Nz_ker//2])
phi_zy = backend.to_numpy(phi[:, Nx_ker//2, :])
phi_zx = backend.to_numpy(phi[Ny_ker//2, :, :])

# prepare figure for slices display
plt.figure(figsize=(15.9, 6.6))
plt.suptitle("Toeplitz kernel (central slices)", weight='demibold')

# display central XY slice (Z = 0)
plt.subplot(1, 3, 1)
extent_xy = [t.item() for t in (xgrid_ker[0], xgrid_ker[-1], ygrid_ker[0], ygrid_ker[-1])]
im_hdl_xy = plt.imshow(phi_xy, extent=extent_xy, origin='lower')
im_hdl_xy.axes.set_xlim(xlim)
im_hdl_xy.axes.set_ylim(ylim)
cmin = np.quantile(phi_xy, .05) # saturate 5% of the slice's smallest values
cmax = np.quantile(phi_xy, .95) # saturate 5% of the slice's highest values
im_hdl_xy.set_clim(cmin, cmax)
plt.colorbar()
plt.xlabel("X (cm)")
plt.ylabel("Y (cm)")
plt.title("XY central slice (Z = %g cm)" % zgrid_ker[Nz_ker//2])

# display central YZ slice (X = 0)
plt.subplot(1, 3, 2)
extent_zy = [t.item() for t in (zgrid_ker[0], zgrid_ker[-1], ygrid_ker[0], ygrid_ker[-1])]
im_hdl_zy = plt.imshow(phi_zy, extent=extent_zy, origin='lower')
im_hdl_zy.axes.set_xlim(xlim)
im_hdl_zy.axes.set_ylim(ylim)
cmin = np.quantile(phi_zy, .05) # saturate 5% of the slice's smallest values
cmax = np.quantile(phi_zy, .95) # saturate 5% of the slice's highest values
im_hdl_zy.set_clim(cmin, cmax)
plt.colorbar()
plt.xlabel("Z (cm)")
plt.ylabel("Y (cm)")
plt.title("ZY central slice (X = %g cm)" % xgrid_ker[Nx_ker//2])

# display central ZX slice (Y = 0)
plt.subplot(1, 3, 3)
extent_zx = [t.item() for t in (zgrid_ker[0], zgrid_ker[-1], xgrid_ker[0], xgrid_ker[-1])]
im_hdl_zx = plt.imshow(phi_zx, extent=extent_zx, origin='lower')
im_hdl_zx.axes.set_xlim(xlim)
im_hdl_zx.axes.set_ylim(ylim)
cmin = np.quantile(phi_zx, .05) # saturate 5% of the slice's smallest values
cmax = np.quantile(phi_zx, .95) # saturate 5% of the slice's highest values
im_hdl_zx.set_clim(cmin, cmax)
plt.colorbar()
plt.xlabel("Z (cm)")
plt.ylabel("X (cm)")
_ = plt.title("ZX central slice (Y = %g cm)" % ygrid_ker[Ny_ker//2])
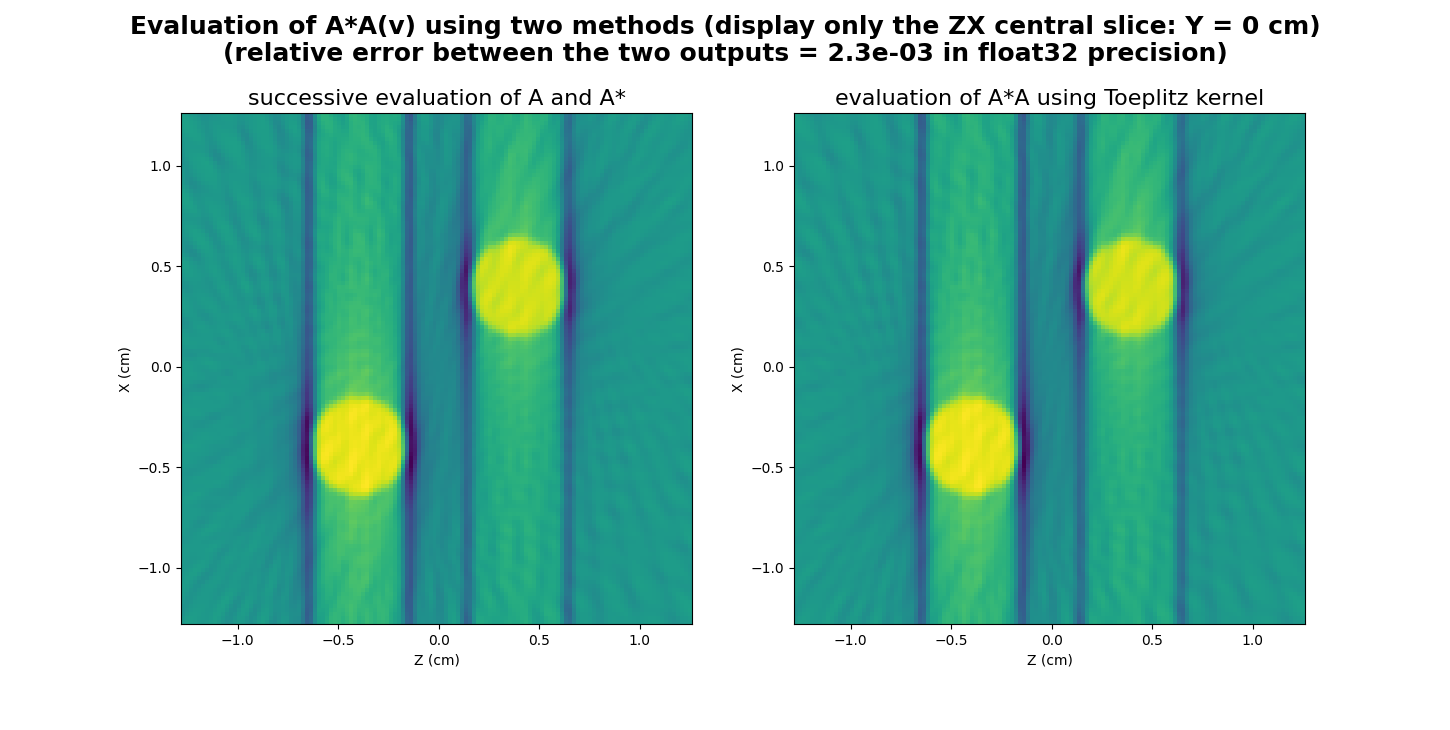
Now let us show how to use this kernel to apply the successive projection-backprojection operation \(A^* \circ A\) to the input image \(v\) defined above.
# --------------------------------------------------- #
# Fast evaluation of A*A(v) using the Toeplitz kernel #
# --------------------------------------------------- #
rfft3_phi = backend.rfftn(phi)
out = monosrc.apply_3d_toeplitz_kernel(v, rfft3_phi, backend=backend)

# -------------------------------------------------------------------- #
# Compute A*A(v) by successive evaluation of A and A* (for comparison) #
# -------------------------------------------------------------------- #
Av = monosrc.proj3d(v, delta, B, h, fgrad, backend=backend)
AstarAv = monosrc.backproj3d(Av, delta, B, h, fgrad, v.shape, backend=backend)

# --------------------------------------------------------- #
# Compare outputs (should be equal up to machine precision) #
# --------------------------------------------------------- #

# display A*A(v) computed by successive evaluation of A and A* (ZX slice)
plt.figure(figsize=(14.5, 7.3))
plt.subplot(1, 2, 1)
extent = [t.item() for t in (zgrid[0], zgrid[-1], xgrid[0], xgrid[-1])]
plt.imshow(backend.to_numpy(AstarAv[Ny//2,:,:]), extent=extent, origin='lower')
plt.xlabel('Z (cm)')
plt.ylabel('X (cm)')
plt.title('successive evaluation of A and A*', fontsize=16)

# display A*A(v) computed using the Toeplitz kernel
plt.subplot(1, 2, 2)
plt.imshow(backend.to_numpy(out[Ny//2,:,:]), extent=extent, origin='lower')
plt.xlabel('Z (cm)')
plt.ylabel('X (cm)')
plt.title('evaluation of A*A using Toeplitz kernel', fontsize=16)

# compute relative error between out and AstarAv
rel = backend.sqrt(((out - AstarAv)**2).sum() / ((AstarAv)**2).sum())
_ = plt.suptitle("Evaluation of A*A(v) using two methods (display only the ZX central slice: Y = %g cm)\n(relative error between the two outputs = %.1e in %s precision)" % (ygrid[Ny//2], rel, dtype), weight='demibold', fontsize=18)
Multiple EPR sources (2D setting)
Now, let us focus on the computation and the usage of cross sources Toeplitz kernels for performing the projection-backprojection of a sequence of two synthetic EPR source images in the two-dimensional setting. First, let us synthesize the two 2D images of the two sources as well as their corresponding reference spectra.
# ------------------------------------------------------------------ #
# Compute synthetic image of the first EPR source (one disk) and its #
# associated reference spectrum (one single line)                    #
# ------------------------------------------------------------------ #

# synthetic 2D image of the first EPR source (disk)
dtype = 'float32'
delta = 5e-3 # sampling step (cm)
Nx, Ny = 550, 400 # image size
xgrid = (-(Nx//2) + backend.arange(Nx, dtype=dtype)) * delta # sampling grid along the X-axis
ygrid = (-(Ny//2) + backend.arange(Ny, dtype=dtype)) * delta # sampling grid along the Y-axis
X, Y = backend.meshgrid(xgrid, ygrid) # spatial sampling grid
u1 = backend.cast(((X + .3)**2 + (Y - .2)**2 <= .1**2), dtype)
u1 /= (delta ** 2) * u1.sum()

# synthetic reference spectrum of the first EPR source (one line
# spectrum synthesized as the derivative of a Gaussian function)
B = backend.linspace(360, 440, 1200, dtype=dtype)
Br1 = 399
sig1 = .36
cof1 = 1. / (sig1 * math.sqrt(2. * math.pi))
h1 = - cof1 * (B - Br1) / sig1**2 * backend.exp(- (B - Br1)**2 / (2. * sig1**2))

# --------------------------------------------------------------- #
# Compute synthetic image of the second EPR source (another disk) #
# and its associated reference spectrum (three lines spectrum)    #
# --------------------------------------------------------------- #

# synthetic 2D image of the second EPR source (disk)
u2 = backend.cast(((X - .3)**2 + (Y + .2)**2 <= .1**2), dtype)
u2 /= (delta ** 2) * u2.sum()

# synthetic reference spectrum of the second EPR source (three line
# spectrum computed by summing shifted Gaussian derivatives)
Br2_left = 382
Br2_middle = 398
Br2_right = 414
sig2 = .8
cof2 = 1. / (3. * sig2 * math.sqrt(2. * math.pi))
h2_left = - cof2 * (B - Br2_left) / sig2**2 * backend.exp(- (B - Br2_left)**2 / (2. * sig2**2))
h2_middle = - cof2 * (B - Br2_middle) / sig2**2 * backend.exp(- (B - Br2_middle)**2 / (2. * sig2**2))
h2_right = - cof2 * (B - Br2_right) / sig2**2 * backend.exp(- (B - Br2_right)**2 / (2. * sig2**2))
h2 = h2_left + h2_middle + h2_right

# ----------------------------------------------- #
# Display source images & their reference spectra #
# ----------------------------------------------- #

# first EPR source image
fig = plt.figure(figsize=(13., 3.8))
plt.subplot(1, 2, 1)
extent = [t.item() for t in (xgrid[0], xgrid[-1], ygrid[0], ygrid[-1])]
plt.imshow(backend.to_numpy(u1), extent=extent, origin='lower')
plt.xlabel('X (cm)')
plt.ylabel('Y (cm)')
plt.title('image source #1')

# reference spectrum of the first EPR source
plt.subplot(1, 2, 2)
plt.plot(backend.to_numpy(B), backend.to_numpy(h1))
plt.xlabel('B: homogeneous magnetic field (G)')
plt.ylabel('spectrum (arb. unit)')
plt.title('reference spectrum source #1')
plt.suptitle('EPR source #1', weight='demibold')

# second EPR source image
fig = plt.figure(figsize=(13., 3.8))
plt.subplot(1, 2, 1)
plt.imshow(backend.to_numpy(u2), extent=extent, origin='lower')
plt.xlabel('X (cm)')
plt.ylabel('Y (cm)')
plt.title('image source #2')

# reference spectrum of the second EPR source
plt.subplot(1, 2, 2)
plt.plot(backend.to_numpy(B), backend.to_numpy(h2))
plt.xlabel('B: homogeneous magnetic field (G)')
plt.ylabel('spectrum (arb. unit)')
plt.title('reference spectrum source #2')
_ = plt.suptitle('EPR source #2', weight='demibold')
Now let us synthesize some field gradient vector coordinates and compute the cross sources Toeplitz kernels associated to the evaluation of the projection-backprojection operation.
# -------------------------------------------------------------------- #
# Compute field gradient vector coordinates (one vector per projection #
# to compute)                                                          #
# -------------------------------------------------------------------- #
theta = backend.linspace(0, 2. * math.pi, 100, dtype=dtype) # field gradient orientations
mu = 20 # field gradient amplitude (G/cm)
gx = mu * backend.cos(theta) # X-axis coordinates of the field gradient vectors
gy = mu * backend.sin(theta) # Y-axis coordinates of the field gradient vectors
fgrad = backend.stack((gx, gy))

# ------------------------ #
# Compute Toeplitz kernels #
# ------------------------ #
shape_src1 = (Ny, Nx) # shape of the source image #1
shape_src2 = (Ny, Nx) # shape of the source image #2
eps = 1e-6 # requested precision (you should use eps = 1e-16 when dtype is 'float64')
psi = multisrc.compute_2d_toeplitz_kernels(B, ((h1, h2),), delta, (fgrad,), (shape_src1, shape_src2), backend=backend, eps=eps)

# ------------------------ #
# Display Toeplitz kernels #
# ------------------------ #

# compute kernel sampling grid (the grid is the same for all kernels
# since, in this particular example, the source images have the same
# dimensions)
Nx_ker, Ny_ker = 2 * Nx, 2 * Ny
xgrid_ker = (-(Nx_ker//2) + backend.arange(Nx_ker, dtype=dtype)) * delta # sampling grid along the X-axis
ygrid_ker = (-(Ny_ker//2) + backend.arange(Ny_ker, dtype=dtype)) * delta # sampling grid along the Y-axis
extent = [t.item() for t in (xgrid_ker[0], xgrid_ker[-1], ygrid_ker[0], ygrid_ker[-1])]

# prepare display
plt.figure(figsize=(11.8, 7.8))
plt.suptitle("Cross sources Toeplitz kernels", weight='demibold')

# display kernel source #1 - source #1 (use saturation for low/high values)
plt.subplot(2, 2, 1)
im_hdl = plt.imshow(backend.to_numpy(psi[0][0]), extent=extent, origin='lower')
cmin = backend.quantile(psi[0][0], .01) # saturate 1% of the smallest values
cmax = backend.quantile(psi[0][0], .99) # saturate 1% of the highest values
im_hdl.set_clim(cmin.item(), cmax.item())
plt.colorbar()
plt.xlabel("X (cm)")
plt.ylabel("Y (cm)")
plt.title("cross sources kernel (#1, #1)")

# display kernel source #1 - source #2 (use saturation for low/high values)
plt.subplot(2, 2, 2)
im_hdl = plt.imshow(backend.to_numpy(psi[0][1]), extent=extent, origin='lower')
cmin = backend.quantile(psi[0][1], .01) # saturate 1% of the smallest values
cmax = backend.quantile(psi[0][1], .99) # saturate 1% of the highest values
im_hdl.set_clim(cmin.item(), cmax.item())
plt.colorbar()
plt.xlabel("X (cm)")
plt.ylabel("Y (cm)")
plt.title("cross sources kernel (#1, #2)")

# display kernel source #2 - source #1 (use saturation for low/high values)
plt.subplot(2, 2, 3)
im_hdl = plt.imshow(backend.to_numpy(psi[1][0]), extent=extent, origin='lower')
cmin = backend.quantile(psi[1][0], .01) # saturate 1% of the smallest values
cmax = backend.quantile(psi[1][0], .99) # saturate 1% of the highest values
im_hdl.set_clim(cmin.item(), cmax.item())
plt.colorbar()
plt.xlabel("X (cm)")
plt.ylabel("Y (cm)")
plt.title("cross sources kernel (#2, #1)")

# display kernel source #2 - source #2 (use saturation for low/high values)
plt.subplot(2, 2, 4)
im_hdl = plt.imshow(backend.to_numpy(psi[1][1]), extent=extent, origin='lower')
cmin = backend.quantile(psi[1][1], .01) # saturate 1% of the smallest values
cmax = backend.quantile(psi[1][1], .99) # saturate 1% of the highest values
im_hdl.set_clim(cmin.item(), cmax.item())
plt.colorbar()
plt.xlabel("X (cm)")
plt.ylabel("Y (cm)")
_ = plt.title("cross sources kernel (#2, #2)")
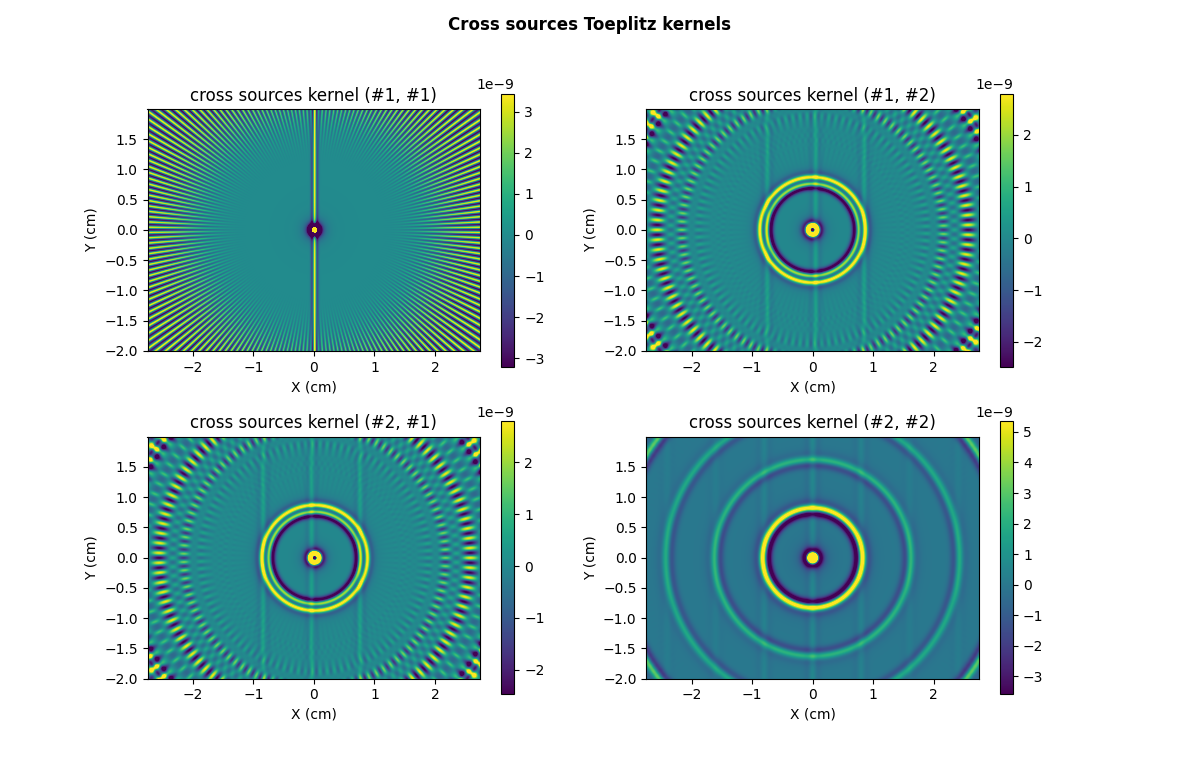
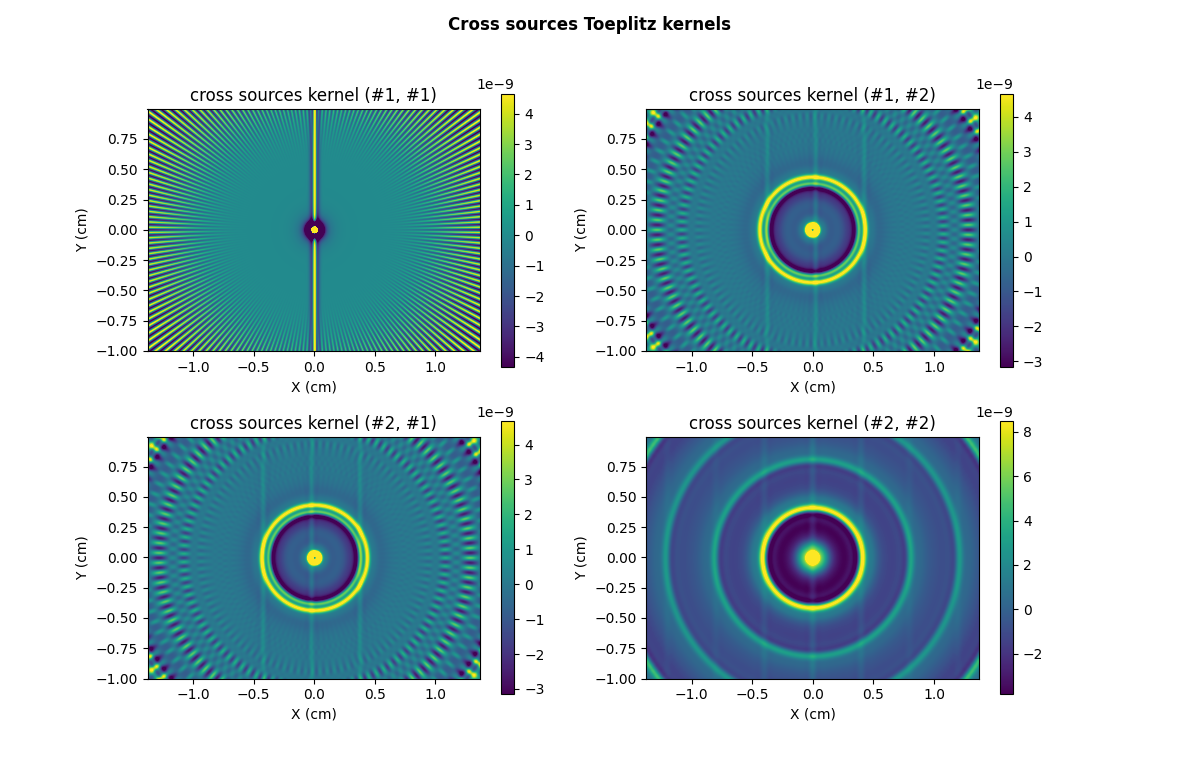
Note: in this particular example, the two sources have the same dimensions, leading to identical cross sources kernels (#1,#2) and (#2,#1). In the more general situation where the two sources have different dimensions, those two kernel are different.
Once the cross sources kernels are computed, the
pyepri.multisrc.apply_2d_toeplitz_kernels() function can be
used to perform the projection-backprojection operation on the
sequence of source images.
# -------------------------------------------------- #
# Compute discrete Fourier transforms of the kernels #
# (this step can be done once and for all)           #
# -------------------------------------------------- #
rfft2_psi = [[backend.rfft2(psi_kj) for psi_kj in psi_k] for psi_k in
             psi]

# --------------------------------------------------- #
# Fast evaluation of A*A(u) using the Toeplitz kernel #
# --------------------------------------------------- #
out = multisrc.apply_2d_toeplitz_kernels((u1, u2), rfft2_psi, backend=backend)

# --------------------- #
# Display output images #
# --------------------- #

# prepare display (note that, in this example, the two source images
# share the same sampling grid)
plt.figure(figsize=(13.8, 5.2))
extent = [t.item() for t in (xgrid[0], xgrid[-1], ygrid[0], ygrid[-1])]
plt.suptitle("Projection-backprojection using Toeplitz kernels of a sequence u = (u1, u2) made of two source images", weight='demibold')

# display output source #1
plt.subplot(1, 2, 1)
plt.imshow(backend.to_numpy(out[0]), extent=extent, origin='lower')
plt.xlabel("X (cm)")
plt.ylabel("Y (cm)")
plt.title("output image #1")

# display output source #2
plt.subplot(1, 2, 2)
plt.imshow(backend.to_numpy(out[1]), extent=extent, origin='lower')
plt.xlabel("X (cm)")
plt.ylabel("Y (cm)")
_ = plt.title("output image #2")
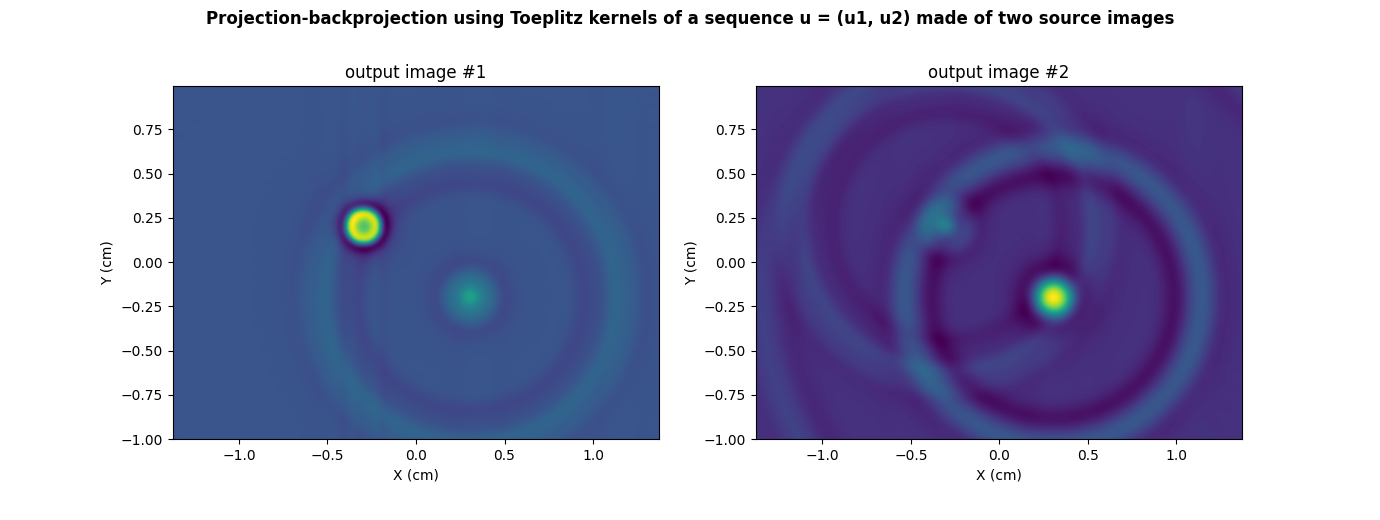
We can check that those output images are the same as those obtained by performing the successive evaluation of the projection and backprojection operations over the sequence of input source images.
# -------------------------------------------------------------------- #
# Compute A*A(u) by successive evaluation of A and A* (for comparison) #
# -------------------------------------------------------------------- #
Au = multisrc.proj2d((u1, u2), delta, B, ((h1, h2),), (fgrad,), backend=backend)
AstarAu = multisrc.backproj2d(Au, delta, B, ((h1, h2),), (fgrad,), (u1.shape, u2.shape), backend=backend)

# ----------------------------------------------------------------------- #
# compute relative errors between the images contained in AstarAu and out #
# ----------------------------------------------------------------------- #
rel1 = backend.sqrt(((out[0] - AstarAu[0])**2).sum() / ((AstarAu[0])**2).sum()).item()
rel2 = backend.sqrt(((out[1] - AstarAu[1])**2).sum() / ((AstarAu[1])**2).sum()).item()
print("relative error output image #1 : %.1e" % rel1)
print("relative error output image #2 : %.1e" % rel2)
print("precision : %s" % dtype)
relative error output image #1 : 1.5e-05
relative error output image #2 : 2.3e-05
precision : float32
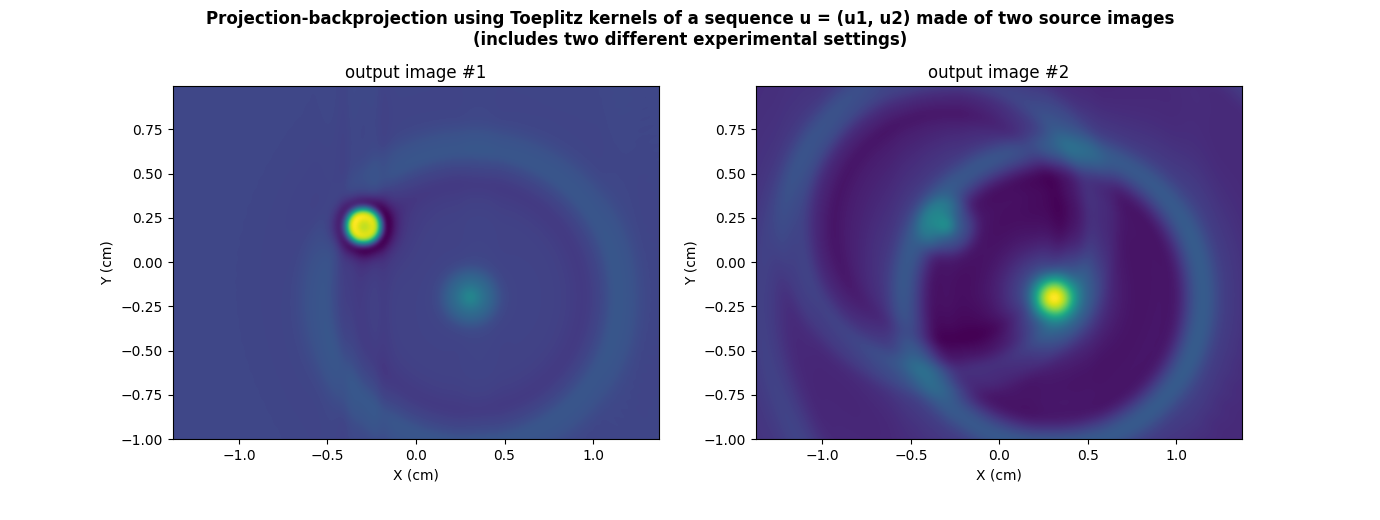
As we illustrated in the projection and backprojection examples, the PyEPRI package supports projection and backprojection of multiple source images in different experimental conditions (provided that the reference spectra of each individual EPR source is provided for each experimental condition). Performing the projection-backprojection operation of a sequence of multiple source in different experimental conditions is also possible using cross sources Toeplitz kernel, as we shall illustrate now.
First, let us compute the reference spectra of the two sources in two different experimental conditions (in this simplified example, we simulate a change of microwave power from one acquisition to another by applying a simple dilatation of the reference spectra of the EPR sources).
# ------------------------------------------------------------------- #
# Simulate synthetic reference spectrum of the first EPR source (one  #
# line spectrum synthesized as the derivative of a Gaussian function) #
# in two experimental settings                                        #
# ------------------------------------------------------------------- #

# synthetic reference spectrum of the first EPR source (one line
# spectrum synthesized as the derivative of a Gaussian function) in
# the first experimental setting
B = backend.linspace(360, 440, 1200, dtype=dtype)
Br1 = 399
sig1_exp1 = .36
cof1_exp1 = 1. / (sig1_exp1 * math.sqrt(2. * math.pi))
h1_exp1 = - cof1_exp1 * (B - Br1) / sig1_exp1**2 * backend.exp(- (B - Br1)**2 / (2. * sig1_exp1**2))

# synthetic reference spectrum of the first EPR source in the second
# experimental setting (dilatation)
sig1_exp2 = 1.5 * sig1_exp1
cof1_exp2 = 1. / (sig1_exp2 * math.sqrt(2. * math.pi))
h1_exp2 = - cof1_exp2 * (B - Br1) / sig1_exp2**2 * backend.exp(- (B - Br1)**2 / (2. * sig1_exp2**2))


# ---------------------------------------------------------------- #
# Simulate synthetic reference spectrum of the second EPR source   #
# (three line spectrum synthesized as the derivative of a Gaussian #
# function) in two experimental settings                           #
# ---------------------------------------------------------------- #

# synthetic reference spectrum of the second EPR source (three line
# spectrum computed by summing shifted Gaussian derivatives) in the
# first experimental setting
Br2_left = 382
Br2_middle = 398
Br2_right = 414
sig2_exp1 = .8
cof2_exp1 = 1. / (3. * sig2_exp1 * math.sqrt(2. * math.pi))
h2_left_exp1 = - cof2_exp1 * (B - Br2_left) / sig2_exp1 * backend.exp(- (B - Br2_left)**2 / (2. * sig2_exp1**2))
h2_middle_exp1 = - cof2_exp1 * (B - Br2_middle) / sig2_exp1 * backend.exp(- (B - Br2_middle)**2 / (2. * sig2_exp1**2))
h2_right_exp1 = - cof2_exp1 * (B - Br2_right) / sig2_exp1 * backend.exp(- (B - Br2_right)**2 / (2. * sig2_exp1**2))
h2_exp1 = h2_left_exp1 + h2_middle_exp1 + h2_right_exp1

# synthetic reference spectrum of the second EPR source in the second
# experimental setting
sig2_exp2 = 3. * sig2_exp1
cof2_exp2 = 1. / (3. * sig2_exp2 * math.sqrt(2. * math.pi))
h2_left_exp2 = - cof2_exp2 * (B - Br2_left) / sig2_exp2 * backend.exp(- (B - Br2_left)**2 / (2. * sig2_exp2**2))
h2_middle_exp2 = - cof2_exp2 * (B - Br2_middle) / sig2_exp2 * backend.exp(- (B - Br2_middle)**2 / (2. * sig2_exp2**2))
h2_right_exp2 = - cof2_exp2 * (B - Br2_right) / sig2_exp2 * backend.exp(- (B - Br2_right)**2 / (2. * sig2_exp2**2))
h2_exp2 = h2_left_exp2 + h2_middle_exp2 + h2_right_exp2

# -------------------------------------------------------------- #
# Display the source images and their reference spectra for each #
# experimental setting                                           #
# -------------------------------------------------------------- #

# prepare display (source #1)
fig = plt.figure(figsize=(17.7, 3.9))
extent = [t.item() for t in (xgrid[0], xgrid[-1], ygrid[0], ygrid[-1])]

# first EPR source image
plt.subplot(1, 3, 1)
plt.imshow(backend.to_numpy(u1), extent=extent, origin='lower')
plt.xlabel('X (cm)')
plt.ylabel('Y (cm)')
plt.title('image source #1')

# first EPR source reference spectrum (first experimental setting)
plt.subplot(1, 3, 2)
plt.plot(backend.to_numpy(B), backend.to_numpy(h1_exp1))
plt.xlabel('B: homogeneous magnetic field (G)')
plt.ylabel('spectrum (arb. unit)')
plt.title('reference spectrum source #1\n(first experimental setting)')

# first EPR source reference spectrum (second experimental setting)
plt.subplot(1, 3, 3)
plt.plot(backend.to_numpy(B), backend.to_numpy(h1_exp2))
plt.xlabel('B: homogeneous magnetic field (G)')
plt.ylabel('spectrum (arb. unit)')
plt.title('reference spectrum source #1\n(second experimental setting)')

# prepare display (source #2)
fig = plt.figure(figsize=(17.7, 3.9))

# second EPR source image
plt.subplot(1, 3, 1)
plt.imshow(backend.to_numpy(u2), extent=extent, origin='lower')
plt.xlabel('X (cm)')
plt.ylabel('Y (cm)')
plt.title('image source #2')

# second EPR source reference spectrum (first experimental setting)
plt.subplot(1, 3, 2)
plt.plot(backend.to_numpy(B), backend.to_numpy(h2_exp1))
plt.xlabel('B: homogeneous magnetic field (G)')
plt.ylabel('spectrum (arb. unit)')
plt.title('reference spectrum source #2\n(first experimental setting)')

# second EPR source reference spectrum (second experimental setting)
plt.subplot(1, 3, 3)
plt.plot(backend.to_numpy(B), backend.to_numpy(h2_exp2))
plt.xlabel('B: homogeneous magnetic field (G)')
plt.ylabel('spectrum (arb. unit)')
_ = plt.title('reference spectrum source #2\n(second experimental setting)')
Now, let us compute the cross sources Toeplitz kernels associated to the projection-backprojection of the sequence of input source images. Note that all reference spectra must be provided to compute the cross sources Toeplitz kernels.
# ------------------------ #
# Compute Toeplitz kernels #
# ------------------------ #
h_exp1 = (h1_exp1, h2_exp1) # reference spectra of the sources in the first experimental setting
h_exp2 = (h1_exp2, h2_exp2) # reference spectra of the sources in the second experimental setting
fgrad_exp1 = fgrad # coordinates of the field gradient vectors in the first experimental setting
fgrad_exp2 = fgrad # coordinates of the field gradient vectors in the first experimental setting
psi = multisrc.compute_2d_toeplitz_kernels(B, (h_exp1, h_exp2), delta, (fgrad_exp1, fgrad_exp2), (shape_src1, shape_src2), eps=eps, backend=backend)

# ------------------------ #
# Display Toeplitz kernels #
# ------------------------ #

# prepare display
plt.figure(figsize=(11.8, 7.8))
plt.suptitle("Cross sources Toeplitz kernels", weight='demibold')

# display kernel source #1 - source #1 (use saturation for low/high values)
plt.subplot(2, 2, 1)
im_hdl = plt.imshow(backend.to_numpy(psi[0][0]), extent=extent, origin='lower')
cmin = backend.quantile(psi[0][0], .01) # saturate 1% of the smallest values
cmax = backend.quantile(psi[0][0], .99) # saturate 1% of the highest values
im_hdl.set_clim(cmin.item(), cmax.item())
plt.colorbar()
plt.xlabel("X (cm)")
plt.ylabel("Y (cm)")
plt.title("cross sources kernel (#1, #1)")

# display kernel source #1 - source #2 (use saturation for low/high values)
plt.subplot(2, 2, 2)
im_hdl = plt.imshow(backend.to_numpy(psi[0][1]), extent=extent, origin='lower')
cmin = backend.quantile(psi[0][1], .01) # saturate 1% of the smallest values
cmax = backend.quantile(psi[0][1], .99) # saturate 1% of the highest values
im_hdl.set_clim(cmin.item(), cmax.item())
plt.colorbar()
plt.xlabel("X (cm)")
plt.ylabel("Y (cm)")
plt.title("cross sources kernel (#1, #2)")

# display kernel source #2 - source #1 (use saturation for low/high values)
plt.subplot(2, 2, 3)
im_hdl = plt.imshow(backend.to_numpy(psi[1][0]), extent=extent, origin='lower')
cmin = backend.quantile(psi[1][0], .01) # saturate 1% of the smallest values
cmax = backend.quantile(psi[1][0], .99) # saturate 1% of the highest values
im_hdl.set_clim(cmin.item(), cmax.item())
plt.colorbar()
plt.xlabel("X (cm)")
plt.ylabel("Y (cm)")
plt.title("cross sources kernel (#2, #1)")

# display kernel source #2 - source #2 (use saturation for low/high values)
plt.subplot(2, 2, 4)
im_hdl = plt.imshow(backend.to_numpy(psi[1][1]), extent=extent, origin='lower')
cmin = backend.quantile(psi[1][1], .01) # saturate 1% of the smallest values
cmax = backend.quantile(psi[1][1], .99) # saturate 1% of the highest values
im_hdl.set_clim(cmin.item(), cmax.item())
plt.colorbar()
plt.xlabel("X (cm)")
plt.ylabel("Y (cm)")
_ = plt.title("cross sources kernel (#2, #2)")
Now, let us perform the projection-backprojection operation.
# -------------------------------------------------- #
# Compute discrete Fourier transforms of the kernels #
# (this step can be done once and for all)           #
# -------------------------------------------------- #
rfft2_psi = [[backend.rfft2(psi_kj) for psi_kj in psi_k] for psi_k in
             psi]

# --------------------------------------------------- #
# Fast evaluation of A*A(u) using the Toeplitz kernel #
# --------------------------------------------------- #
out = multisrc.apply_2d_toeplitz_kernels((u1, u2), rfft2_psi, backend=backend)

# --------------------- #
# Display output images #
# --------------------- #

# prepare display (note that, in this example, the two source images
# share the same sampling grid)
plt.figure(figsize=(13.8, 5.2))
extent = [t.item() for t in (xgrid[0], xgrid[-1], ygrid[0], ygrid[-1])]
plt.suptitle("Projection-backprojection using Toeplitz kernels of a sequence u = (u1, u2) made of two source images\n(includes two different experimental settings)", weight='demibold')

# display output source #1
plt.subplot(1, 2, 1)
plt.imshow(backend.to_numpy(out[0]), extent=extent, origin='lower')
plt.xlabel("X (cm)")
plt.ylabel("Y (cm)")
plt.title("output image #1")

# display output source #2
plt.subplot(1, 2, 2)
plt.imshow(backend.to_numpy(out[1]), extent=extent, origin='lower')
plt.xlabel("X (cm)")
plt.ylabel("Y (cm)")
_ = plt.title("output image #2")
Multiple EPR sources (3D setting)
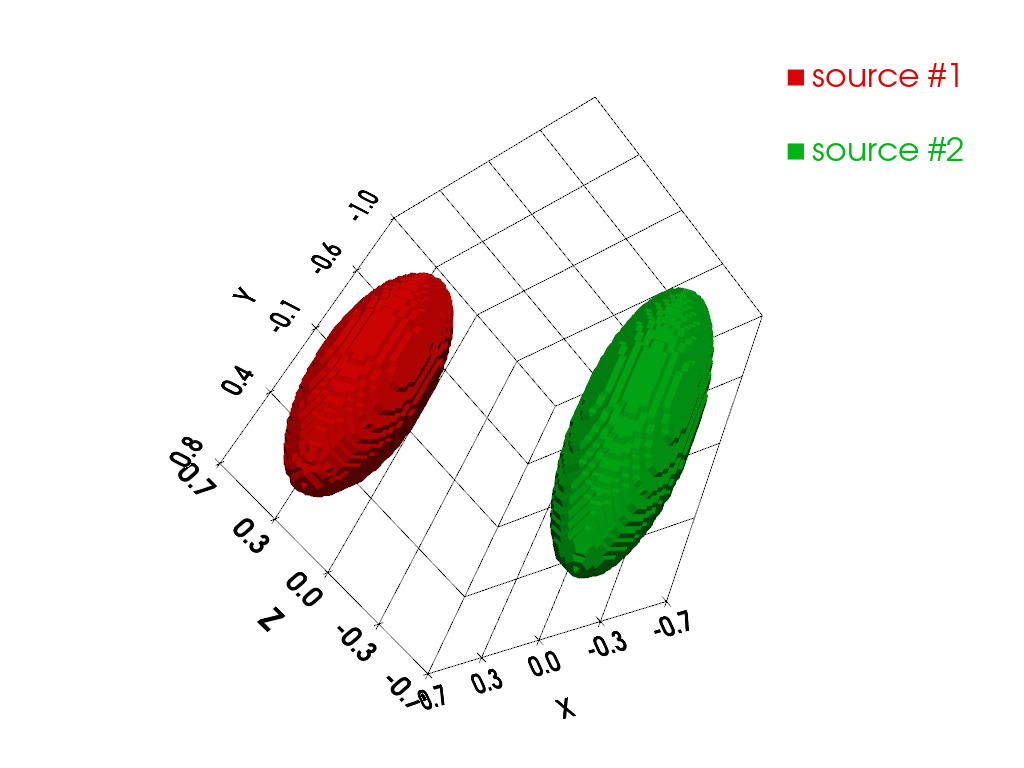
In this last section, let us focus on the computation and the usage of cross sources Toeplitz kernels for performing the projection-backprojection of a sequence of two synthetic EPR source images in the three-dimensional setting. First, let us synthesize the two 3D images of the EPR sources.
# ---------------------------------------------------- #
# Compute a synthetic 3D images of the two EPR sources #
# ---------------------------------------------------- #

# compute sampling grids (the two sources images must share the same
# sampling step but can have different size, although we will use here
# the same size for both images)
Nx, Ny, Nz = 128, 256, 128 # image dimensions
delta = .02 # spatial sampling step (cm)
xgrid = (-(Nx//2) + backend.arange(Nx, dtype=dtype)) * delta
ygrid = (-(Ny//2) + backend.arange(Ny, dtype=dtype)) * delta
zgrid = (-(Nz//2) + backend.arange(Nz, dtype=dtype)) * delta
X, Y, Z = backend.meshgrid(xgrid, ygrid, zgrid)

# first source image (ellipsoid)
v_src1 = backend.cast(((X - .4) / .25)**2 + ((Y - .1) / .7)**2 + (((Z - .4) / .25)**2) <= 1., dtype=dtype)
v_src1 /= (delta**3 * v_src1.sum())

# second source image (another ellipsoid)
v_src2 = backend.cast(((X + .4) / .25)**2 + ((Y + .1) / .9)**2 + (((Z + .4) / .25)**2) <= 1., dtype=dtype)
v_src2 /= (delta**3 * v_src2.sum())

# ----------------------------------- #
# Display input 3D image (isosurface) #
# ----------------------------------- #

# compute isosurface sampling grid
grid = pv.StructuredGrid(backend.to_numpy(X), backend.to_numpy(Y), backend.to_numpy(Z))

# compute isosurface for the first source image
vol = np.moveaxis(backend.to_numpy(v_src1), (0,1,2), (2,1,0))
grid["vol"] = vol.flatten()
l1 = vol.max()
l0 = .2 * l1
isolevels = np.linspace(l0, l1, 10)
contours_src1 = grid.contour(isolevels)

# compute isosurface for the second source image
vol = np.moveaxis(backend.to_numpy(v_src2), (0,1,2), (2,1,0))
grid["vol"] = vol.flatten()
l1 = vol.max()
l0 = .2 * l1
isolevels = np.linspace(l0, l1, 10)
contours_src2 = grid.contour(isolevels)

# display isosurfaces
cpos = [(-3.8, 4.35, 2.11), (0.0, -0.1, 0.0), (-0.33, -0.62, 0.71)]
p = pv.Plotter()
p.camera_position = cpos
labels = dict(ztitle='Z', xtitle='X', ytitle='Y')
p.add_mesh(contours_src1, show_scalar_bar=False, color='#db0404', label=' source #1')
p.add_mesh(contours_src2, show_scalar_bar=False, color='#01b517', label=' source #2')
p.show_grid(**labels)
p.add_legend(face='r')
p.show()
Next, let us compute and display the synthetic reference spectra of the two EPR sources as well as the field gradient vectors involved in the projection-backprojection operation.
# ----------------------------------------------------------------- #
# Compute synthetic reference spectrum of the first EPR source (one #
# line spectrum)                                                    #
# ----------------------------------------------------------------- #
B = backend.linspace(360, 440, 1200, dtype=dtype)
Br1 = 399
sig1 = .36
cof1 = 1. / (sig1 * math.sqrt(2. * math.pi))
h1 = - cof1 * (B - Br1) / sig1**2 * backend.exp(- (B - Br1)**2 / (2. * sig1**2))

# -------------------------------------------------------------------- #
# Compute synthetic reference spectrum of the second EPR source (three #
# lines spectrum)                                                      #
# -------------------------------------------------------------------- #
Br2_left = 382
Br2_middle = 398
Br2_right = 414
sig2 = .8
cof2 = 1. / (3. * sig2 * math.sqrt(2. * math.pi))
h2_left = - cof2 * (B - Br2_left) / sig2**2 * backend.exp(- (B - Br2_left)**2 / (2. * sig2**2))
h2_middle = - cof2 * (B - Br2_middle) / sig2**2 * backend.exp(- (B - Br2_middle)**2 / (2. * sig2**2))
h2_right = - cof2 * (B - Br2_right) / sig2**2 * backend.exp(- (B - Br2_right)**2 / (2. * sig2**2))
h2 = h2_left + h2_middle + h2_right

# ------------------------------------------ #
# Compute field gradient vectors coordinates #
# ------------------------------------------ #
t1 = backend.linspace(0, 2. * math.pi, 32, dtype=dtype)
t2 = backend.linspace(0, 2. * math.pi, 32, dtype=dtype)
theta1, theta2 = backend.meshgrid(t1, t2)
theta1 = theta1.reshape((-1,)) # polar angles of the field gradients
theta2 = theta2.reshape((-1,)) # azimuthal angles of the field gradients
mu = 15 # field gradient amplitude (G/cm)
gx = mu * backend.cos(theta1) * backend.sin(theta2) # X-axis coordinates of the field gradient vectors
gy = mu * backend.sin(theta1) * backend.sin(theta2) # Y-axis coordinates of the field gradient vectors
gz = mu * backend.cos(theta2) # Z-axis coordinates of the field gradient vectors
fgrad = backend.stack((gx, gy, gz))

# ---------------------------------------------------- #
# Display reference spectra and field gradient vectors #
# ---------------------------------------------------- #

# reference spectrum of the first EPR source
fig = plt.figure(figsize=(15, 4.))
fig.add_subplot(1, 3, 1)
plt.plot(backend.to_numpy(B), backend.to_numpy(h1))
plt.grid(linestyle=':')
plt.xlabel('B: homogeneous magnetic field (G)')
plt.ylabel('spectrum (arb. unit)')
plt.title('reference spectrum source #1')

# reference spectrum of the second EPR source
fig.add_subplot(1, 3, 2)
plt.plot(backend.to_numpy(B), backend.to_numpy(h2))
plt.grid(linestyle=':')
plt.xlabel('B: homogeneous magnetic field (G)')
#plt.ylabel('spectrum (arb. unit)')
plt.title('reference spectrum source #2')

# magnetic field gradient vectors
ax = fig.add_subplot(1, 3, 3, projection='3d')
ax.scatter(backend.to_numpy(fgrad[0]), backend.to_numpy(fgrad[1]), backend.to_numpy(fgrad[2]))
ax.set_xlabel('X (cm)')
ax.set_ylabel('Y (cm)')
ax.set_zlabel('Z (cm)')
ax.set_aspect('equal', 'box')
_ = plt.title('magnetic field gradient samples')

Now, let us compute the cross sources Toeplitz kernels associated to the projection-backprojection of the sequence of input source images.
# ------------------------ #
# Compute Toeplitz kernels #
# ------------------------ #
shape_src1 = (Ny, Nx, Nz) # shape of the source image #1
shape_src2 = (Ny, Nx, Nz) # shape of the source image #2
eps = 1e-6 # requested precision (you should use eps = 1e-16 when dtype is 'float64')
psi = multisrc.compute_3d_toeplitz_kernels(B, ((h1, h2),), delta, (fgrad,), (shape_src1, shape_src2), eps=eps, backend=backend)

# ------------------------------------------------- #
# Display Toeplitz kernels (only XY central slices) #
# ------------------------------------------------- #

# compute kernel sampling grid (the grid is the same for all kernels
# since, in this particular example, the source images have the same
# dimensions)
Nx_ker, Ny_ker, Nz_ker = 2 * Nx, 2 * Ny, 2 * Nz
xgrid_ker = (-(Nx_ker//2) + backend.arange(Nx_ker, dtype=dtype)) * delta # sampling grid along the X-axis
ygrid_ker = (-(Ny_ker//2) + backend.arange(Ny_ker, dtype=dtype)) * delta # sampling grid along the Y-axis
zgrid_ker = (-(Nz_ker//2) + backend.arange(Nz_ker, dtype=dtype)) * delta # sampling grid along the Z-axis
extent = [t.item() for t in (xgrid_ker[0], xgrid_ker[-1], ygrid_ker[0], ygrid_ker[-1])]

# prepare display
plt.figure(figsize=(13.9, 6.85))
plt.suptitle("Cross sources Toeplitz kernels (only XY central slices, Z=0)", weight='demibold')

# display kernel source #1 - source #1 (use saturation for low/high values)
plt.subplot(1, 3, 1)
im_hdl = plt.imshow(backend.to_numpy(psi[0][0][:, :, Nz_ker//2]), extent=extent, origin='lower')
cmin = backend.quantile(psi[0][0][:, :, Nz_ker//2], .01) # saturate 1% of the smallest values
cmax = backend.quantile(psi[0][0][:, :, Nz_ker//2], .99) # saturate 1% of the highest values
im_hdl.set_clim(cmin.item(), cmax.item())
plt.colorbar()
plt.xlabel("X (cm)")
plt.ylabel("Y (cm)")
plt.title("cross sources kernel (#1, #1)")

# display kernel source #1 - source #2 (use saturation for low/high values)
plt.subplot(1, 3, 2)
im_hdl = plt.imshow(backend.to_numpy(psi[0][1][:, :, Nz_ker//2]), extent=extent, origin='lower')
cmin = backend.quantile(psi[0][1][:, :, Nz_ker//2], .01) # saturate 1% of the smallest values
cmax = backend.quantile(psi[0][1][:, :, Nz_ker//2], .99) # saturate 1% of the highest values
im_hdl.set_clim(cmin.item(), cmax.item())
plt.colorbar()
plt.xlabel("X (cm)")
plt.ylabel("Y (cm)")
plt.title("cross sources kernel (#1, #2)")

# display kernel source #2 - source #2 (use saturation for low/high values)
plt.subplot(1, 3, 3)
im_hdl = plt.imshow(backend.to_numpy(psi[1][1][:, :, Nz_ker//2]), extent=extent, origin='lower')
cmin = backend.quantile(psi[1][1][:, :, Nz_ker//2], .01) # saturate 1% of the smallest values
cmax = backend.quantile(psi[1][1][:, :, Nz_ker//2], .99) # saturate 1% of the highest values
im_hdl.set_clim(cmin.item(), cmax.item())
plt.colorbar()
plt.xlabel("X (cm)")
plt.ylabel("Y (cm)")
_ = plt.title("cross sources kernel (#2, #2)")
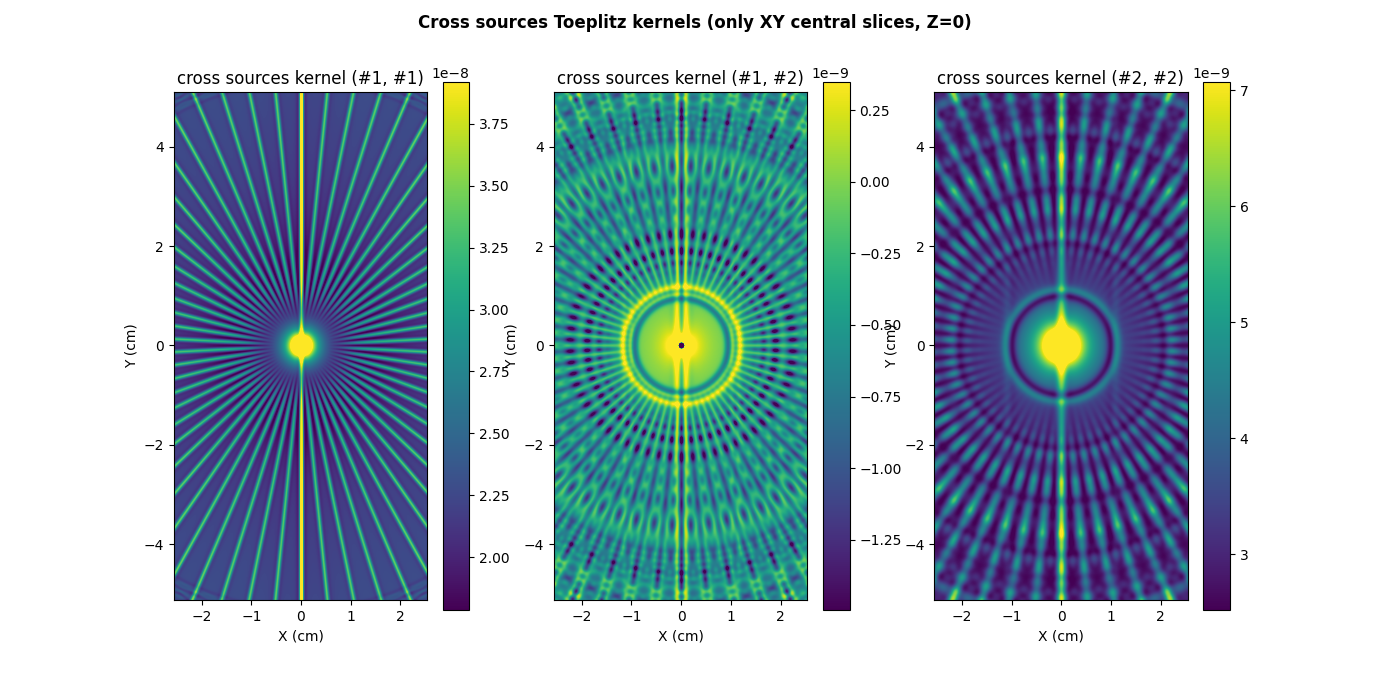
Notice that we only displayed above three cross sources Toeplitz kernels among the four kernels because, as mentioned earlier, sources #1 and #2 share the same dimensions and thus, the cross sources Toeplitz kernels (#1, #2) and (#2, #1) are identical.
Now that the cross sources Toeplitz kernels are computed, let us use
the pyepri.multisrc.apply_3d_toeplitz_kernels() function to
perform the projection-backprojection operation.
# -------------------------------------------------- #
# Compute discrete Fourier transforms of the kernels #
# (this step can be done once and for all)           #
# -------------------------------------------------- #
rfft3_psi = [[backend.rfftn(psi_kj) for psi_kj in psi_k] for psi_k in
             psi]

# --------------------------------------------------- #
# Fast evaluation of A*A(u) using the Toeplitz kernel #
# --------------------------------------------------- #
out = multisrc.apply_3d_toeplitz_kernels((v_src1, v_src2), rfft3_psi, backend=backend)

# ---------------------------------------- #
# Display output images (ZX slices, Y = 0) #
# ---------------------------------------- #

# prepare display
plt.figure(figsize=(11., 5.6))
extent = [t.item() for t in (xgrid[0], xgrid[-1], zgrid[0], zgrid[-1])]
plt.suptitle("Projection-backprojection using Toeplitz kernels of a sequence v = (v1, v2) of two sources images", weight='demibold')

# projected-backprojected output #1
plt.subplot(1, 2, 1)
plt.imshow(backend.to_numpy(out[0][Ny//2, :, :]), extent=extent, origin='lower')
plt.xlabel('X (cm)')
plt.ylabel('Z (cm)')
plt.title('output image #1 (ZX slice, Y = %g)' % ygrid[Ny//2].item())

# projected-backprojected output #2
plt.subplot(1, 2, 2)
plt.imshow(backend.to_numpy(out[1][Ny//2, :, :]), extent=extent, origin='lower')
plt.xlabel('X (cm)')
plt.ylabel('Z (cm)')
_ = plt.title('output image #2 (ZX slice, Y = %g)' % ygrid[Ny//2].item())
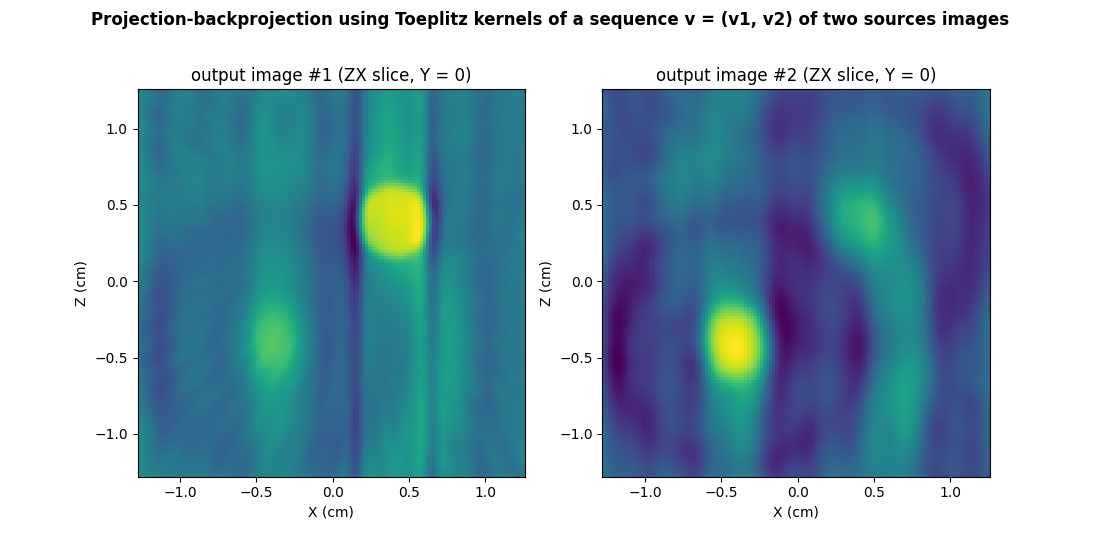
Of course, we can easily control that the output images generated using the Toeplitz kernel are identical (up to moderate numerical errors) to those obtained by performing the successive evaluation of the projection and backprojection operations over the sequence of input source images.
# -------------------------------------------------------------------- #
# Compute A*A(v) by successive evaluation of A and A* (for comparison) #
# -------------------------------------------------------------------- #
Av = multisrc.proj3d((v_src1, v_src2), delta, B, ((h1, h2),), (fgrad,), backend=backend)
AstarAv = multisrc.backproj3d(Av, delta, B, ((h1, h2),), (fgrad,), (v_src1.shape, v_src2.shape), backend=backend)

# ----------------------------------------------------------------------- #
# compute relative errors between the images contained in AstarAu and out #
# ----------------------------------------------------------------------- #
rel1 = backend.sqrt(((out[0] - AstarAv[0])**2).sum() / ((AstarAv[0])**2).sum()).item()
rel2 = backend.sqrt(((out[1] - AstarAv[1])**2).sum() / ((AstarAv[1])**2).sum()).item()
print("relative error output image #1 : %.1e" % rel1)
print("relative error output image #2 : %.1e" % rel2)
print("precision : %s" % dtype)
relative error output image #1 : 2.0e-03
relative error output image #2 : 1.2e-03
precision : float32
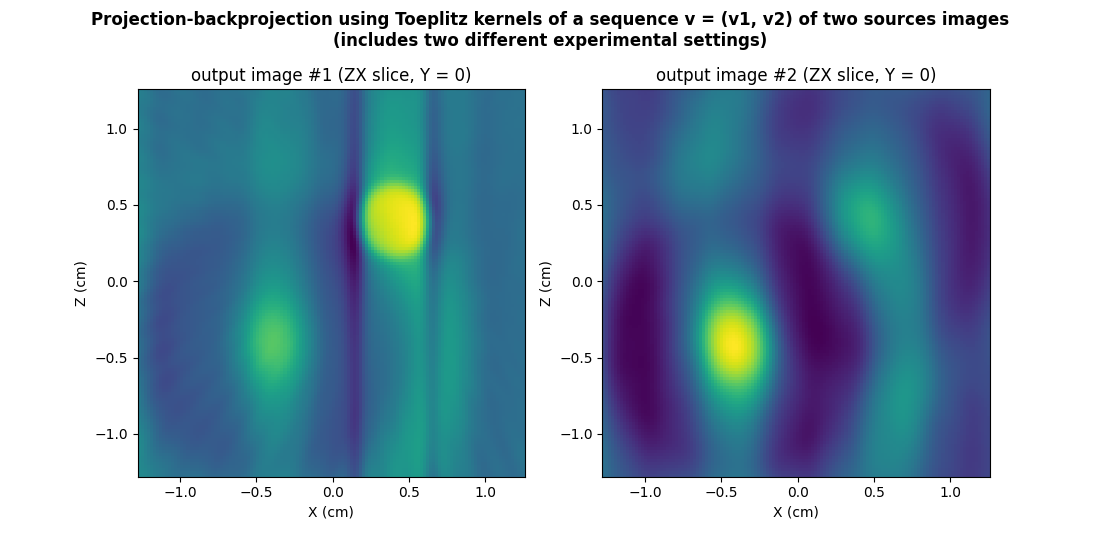
Let us conclude this section by showing how the projection-backprojection of multiple 3D source images in different experimental conditions can be handled using Toeplitz kernels. For that purpose, we will use below the previously computed (synthetic) reference spectra of the two EPR sources that where synthesized in two different acquisition conditions (see above).
# ------------------------ #
# Compute Toeplitz kernels #
# ------------------------ #
h_exp1 = (h1_exp1, h2_exp1) # reference spectra of the sources in the first experimental setting
h_exp2 = (h1_exp2, h2_exp2) # reference spectra of the sources in the second experimental setting
fgrad_exp1 = fgrad # coordinates of the field gradient vectors in the first experimental setting
fgrad_exp2 = fgrad # coordinates of the field gradient vectors in the first experimental setting
psi = multisrc.compute_3d_toeplitz_kernels(B, (h_exp1, h_exp2), delta, (fgrad_exp1, fgrad_exp2), (shape_src1, shape_src2), eps=eps, backend=backend)

# -------------------------------------------------- #
# Compute discrete Fourier transforms of the kernels #
# (this step can be done once and for all)           #
# -------------------------------------------------- #
rfft3_psi = [[backend.rfftn(psi_kj) for psi_kj in psi_k] for psi_k in
             psi]

# --------------------------------------------------- #
# Fast evaluation of A*A(v) using the Toeplitz kernel #
# --------------------------------------------------- #
out = multisrc.apply_3d_toeplitz_kernels((v_src1, v_src2), rfft3_psi, backend=backend)

# ---------------------------------------- #
# Display output images (ZX slices, Y = 0) #
# ---------------------------------------- #

# prepare display
plt.figure(figsize=(11., 5.6))
extent = [t.item() for t in (xgrid[0], xgrid[-1], zgrid[0], zgrid[-1])]
plt.suptitle("Projection-backprojection using Toeplitz kernels of a sequence v = (v1, v2) of two sources images\n(includes two different experimental settings)", weight='demibold')

# projected-backprojected output #1
plt.subplot(1, 2, 1)
plt.imshow(backend.to_numpy(out[0][Ny//2, :, :]), extent=extent, origin='lower')
plt.xlabel('X (cm)')
plt.ylabel('Z (cm)')
plt.title('output image #1 (ZX slice, Y = %g)' % ygrid[Ny//2].item())

# projected-backprojected output #2
plt.subplot(1, 2, 2)
plt.imshow(backend.to_numpy(out[1][Ny//2, :, :]), extent=extent, origin='lower')
plt.xlabel('X (cm)')
plt.ylabel('Z (cm)')
_ = plt.title('output image #2 (ZX slice, Y = %g)' % ygrid[Ny//2].item())
Total running time of the script: (0 minutes 25.447 seconds)
Estimated memory usage: 3592 MB


